Third Quarter 2022 Investment Commentary
Summary of key points:
- As core inflation remains stubbornly high, and the Federal Reserve continues to implement aggressive monetary policy tightening, we see an increasingly high risk of an economic and earnings recession over a shorter-term (12-month) horizon.
- While equity markets have sold off over the past several weeks from their mid-summer highs, we do not believe they adequately discount this earnings recession risk.
- In the meantime, core bond yields have risen materially this year, to the point where equities are also no longer relatively cheap versus bonds.
- Putting all the macro and market pieces together – weighing the shorter-term equity market downside risks, the improved core bond expected returns, and our medium-term (five-year) return expectations across the wide range of scenarios that we believe are reasonably probable – we are tactically reducing equity risk in favor of core bonds with their now higher yields and better defensive characteristics.
- We are reducing our equity allocation by 2% to 5% depending on the portfolio, and increasing our recessionary “ballast” in core bonds.
Third Quarter Market Recap
After a very difficult first half of the year, equity markets rebounded in July and August on investor hopes of an easing in inflation and a Fed pivot or pause. The reprieve was short-lived however, as stocks tumbled to fresh lows in late September amid further aggressive central bank rate hikes and statements of further tightening to come.
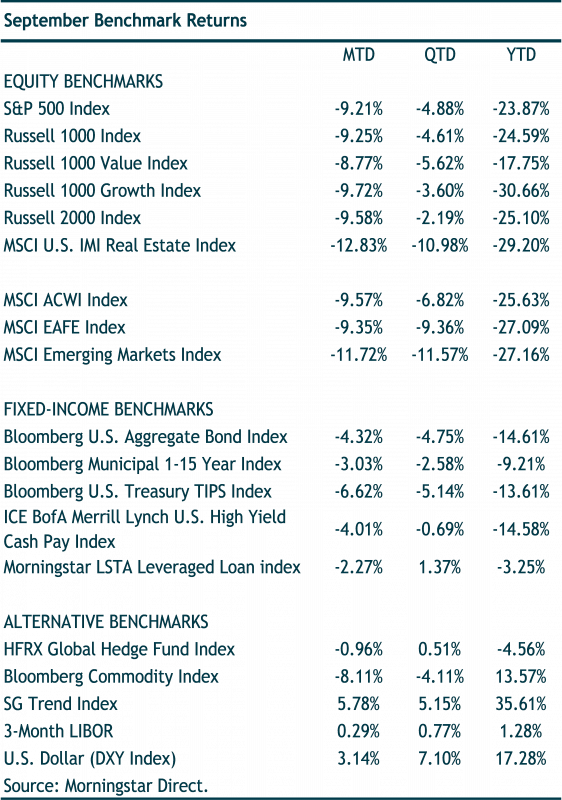
Global stocks (MSCI ACWI Index) fell 6.82% for the quarter and are down 25.63% for the year. The S&P 500 dropped 4.88% for the quarter and is down 23.87% for the year. Developed international markets (MSCI EAFE Index) fell 9.36% for the quarter and 27.09% YTD. Emerging Market stocks (MSCI Emerging Markets Index) dropped 11.57% for the quarter, and down 27.16% YTD.
Foreign equity market returns for U.S. dollar-based investors were worsened by the sharp appreciation of the dollar. The U.S. Dollar Index was up 7.1% for the quarter and a stunning 17.3% on the year, hitting a 20-year high. These dollar gains translate into roughly comparable losses for U.S. dollar-based investors investing in international equity markets. For example, the MSCI EAFE Currency Hedged Index return this year is -13.0% vs. -27.1% unhedged; and the MSCI EM Currency Hedged Index has lost about six percentage points less than the MSCI EM Index unhedged (our benchmark). A reversal in the dollar would be a major tailwind for unhedged foreign equity returns going forward.
Core investment-grade bonds didn’t avoid the Q3 carnage. The 10-year Treasury yield hit a decade high of 3.97%, causing the Bloomberg U.S. Aggregate Bond Index (the “Agg”) to drop 4.75%. This puts the “safe-haven” Agg down an incredible 14.61% for the year to date. In other segments of the fixed-income markets, high-yield bonds (ICE BofA Merrill Lynch U.S. High Yield Index) dropped 0.68% and floating rate loans (Morningstar LSTA Leveraged Loan index) gained 1.37% for the quarter. For the year to date, floating rate loans have been one of the best performers, down just 3.25%.
Our allocations to “non-traditional” asset classes -- non-core fixed-income market segments and alternative strategies – benefited our balanced portfolios again in the third quarter. Trend-following managed futures strategies were the standout performers once again, posting gains in the low-to-mid single digits for the quarter, and returning 23% to 47% for the year, depending on the fund.
Macro Outlook: Increasingly High Risk of Recession as High Core Inflation and Aggressive Fed Tightening Persist
Inflation
The economic backdrop for the U.S. and global economy deteriorated further in the third quarter, continuing a trend we highlighted last quarter. Stubbornly high Inflation remains the key economic indicator. High inflation is driving U.S. and global central banks’ to further tighten monetary policy and hike interest rates. Central banks are raising their policy rates (the “fed funds” rate for the U.S. Federal Reserve) to attempt to bring down inflation by curtailing “aggregate demand” – consumer and business spending.
The Fed’s policy hammer of higher interest rates will eventually pound down GDP growth and increase unemployment. The odds the Fed can engineer an economic soft landing -- where the U.S. economy slows to below-trend GDP growth with somewhat higher unemployment but does not fall into a deep recession with much higher unemployment – are increasingly slim.
While headline CPI inflation (excluding food and energy) seems to have peaked, core inflation measures have continued to rise and are far above the Fed’s 2% target. This indicates inflationary pressures have become more widespread throughout the economy, rather than driven by a few extreme outliers as in 2021.
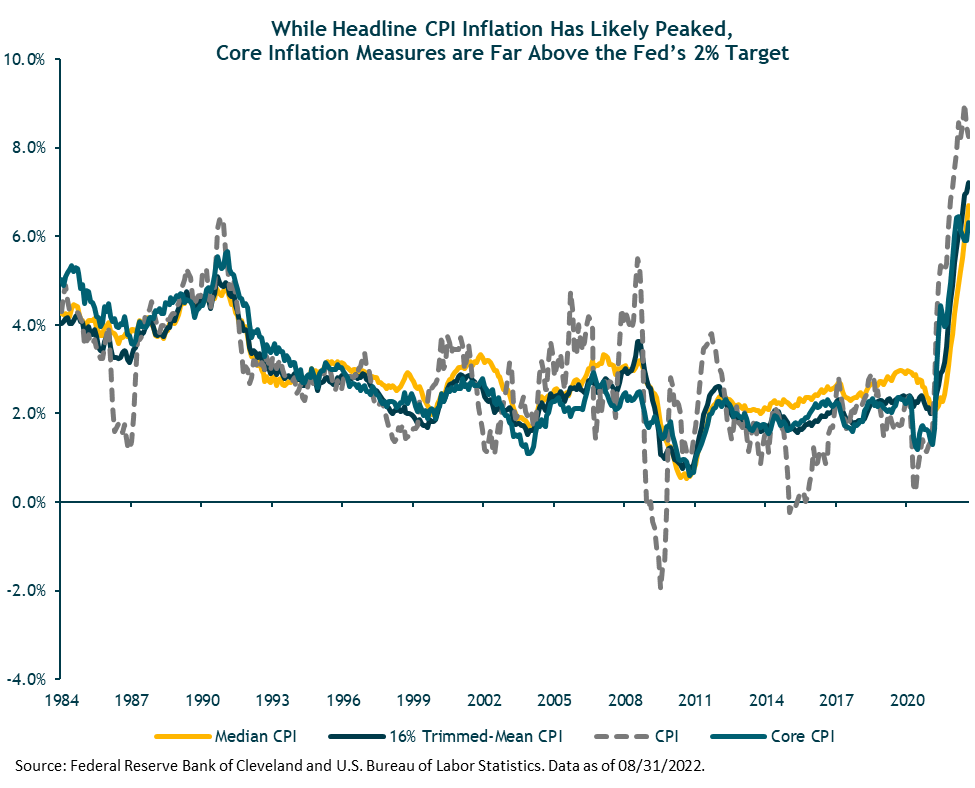
Some of this broad-based core inflation is still due to “transitory” COVID-related supply-side disruptions and production/distribution bottlenecks. Central banks can’t do anything about these short-term supply-side inflationary forces. But the good news is that many of these supply-chain disruptions are dissipating as the pandemic recedes globally. (China’s ongoing zero-COVID policy lockdowns are a notable exception. Most China-watchers don’t expect the government to relax this policy until 2023 after more effective vaccinations are widely implemented.)
However, the demand-side drivers of core inflation in the U.S. have not yet peaked, let alone demonstrated the consistent month-over-month declines that Fed Chair Jerome Powell says the Fed is looking for as “clear evidence” inflation is headed to their 2% target.
As such, and as expected, at its September 21 meeting, the Federal Open Market Committee (FOMC) raised the fed funds rate by 75 bps to a target range of 3.0% to 3.25%. The FOMC’s new median forecast is for another 125bp (1.25%) increase over their next two meetings in November and December, ending the year between 4.25% and 4.5%.

The FOMC also sharply cut its GDP growth forecast to just 0.2% for 2022, and a sub-par 1.2% in 2023. The long-term trend U.S. GDP growth rate is estimated to be around 2%, based on expected U.S. labor force and productivity growth rates.
It’s worth reminding ourselves that just nine months ago at its December 2021 meeting, the FOMC’s median forecast was for the fed funds target range to be 0.75% to 1.0% at the end of this year, with real GDP growth a very strong 4.0%. Little more need be said about the Fed’s (or anyone else’s) ability to predict key macroeconomic variables consistently and accurately over time.
In addition to higher rates and lower growth, the FOMC also increased its unemployment rate forecast, to 4.4% next year. If that plays out, history suggests a recession is likely. Since 1950, there has never been an instance where the U.S. unemployment rate has increased by a half percent or more from its cycle low without an accompanying recession. The unemployment rate bottomed at 3.5% in July. (We’ll discuss other strong indicators of an oncoming recession a bit later in this commentary.)
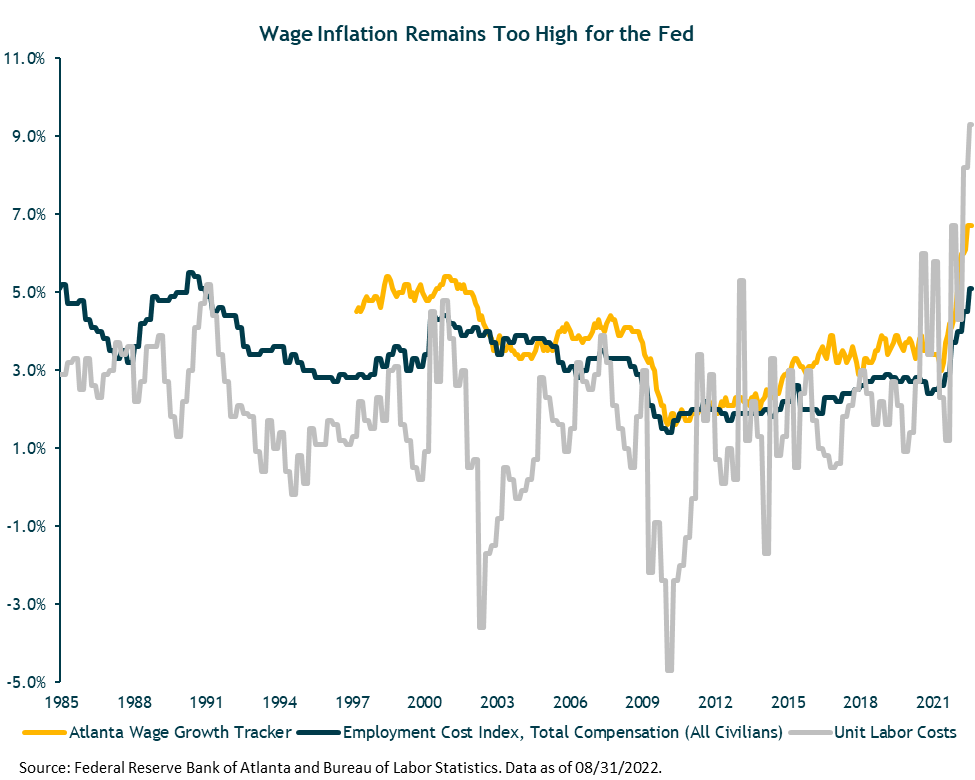
Two key inflation variables the Fed is focused on are (1) the labor market – wage inflation specifically – and (2) inflation expectations. The data here continue to be mixed.
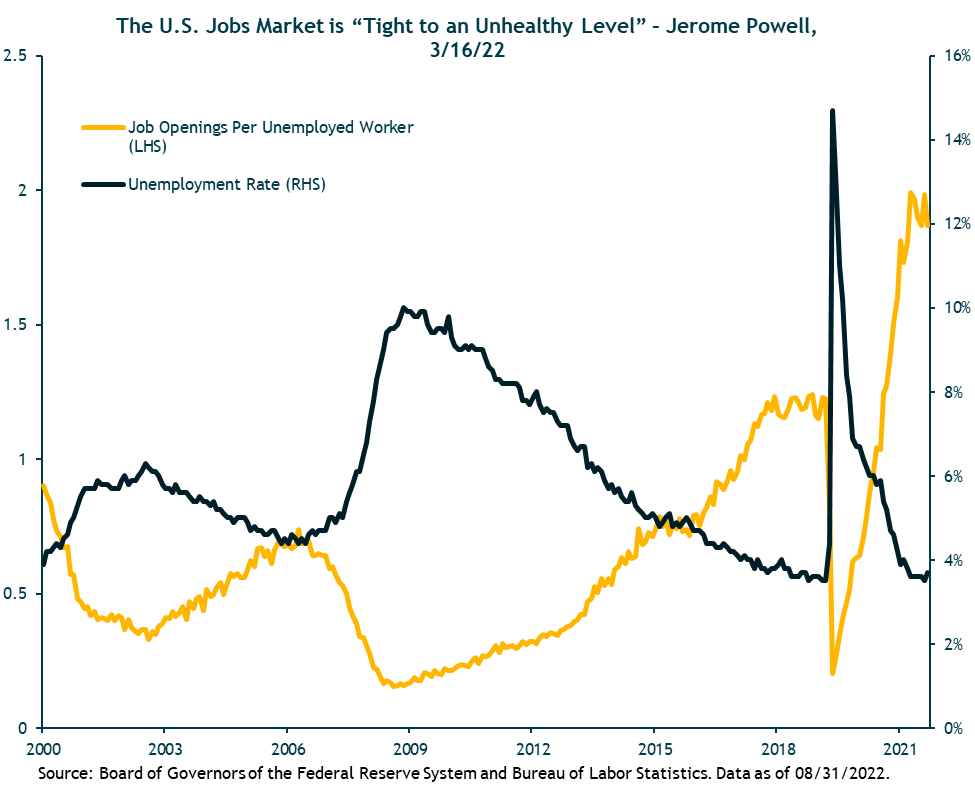
Wages: U.S. wage growth (wage inflation) is high and still rising. The U.S labor market remains very tight. The 3.7% unemployment rate is near all-time lows, while the ratio of Job Openings to Unemployed workers looking for a job remains near all-time highs at 2-to-1. This suggests continued upward wage pressure is likely at least until the labor market materially weakens, which is the Fed’s aim.
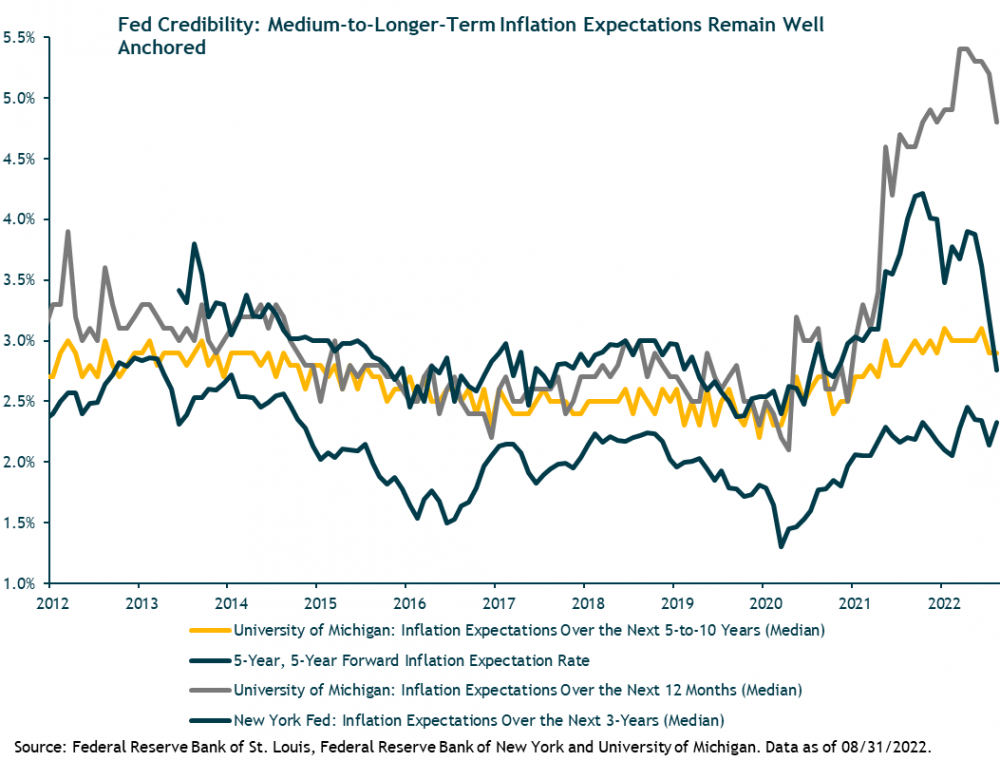
Inflation Expectations: On the positive side, consumer surveys and market-based measures suggest medium-to-longer-term inflation expectations remain well-anchored, consistent with the Fed ultimately achieving its 2% core inflation objective. Short-term inflation expectations, which are highly sensitive to gas prices, have also dropped recently.
Inflation expectations are crucial, because if they become unmoored they can feed into a self-perpetuating, inflationary wage-price spiral, where wage and price hikes feed back into higher inflationary expectations which feed into further wage and price hikes, etc. This was essentially the inflationary regime that Fed Chair Paul Volcker had to break in the early 1980s. One huge difference (among many) between now and then is that medium-to-longer term inflation expectations reached double-digits in Volcker’s time – requiring a double-digit fed funds rate to ultimately crush -- versus their 2-3% range today.
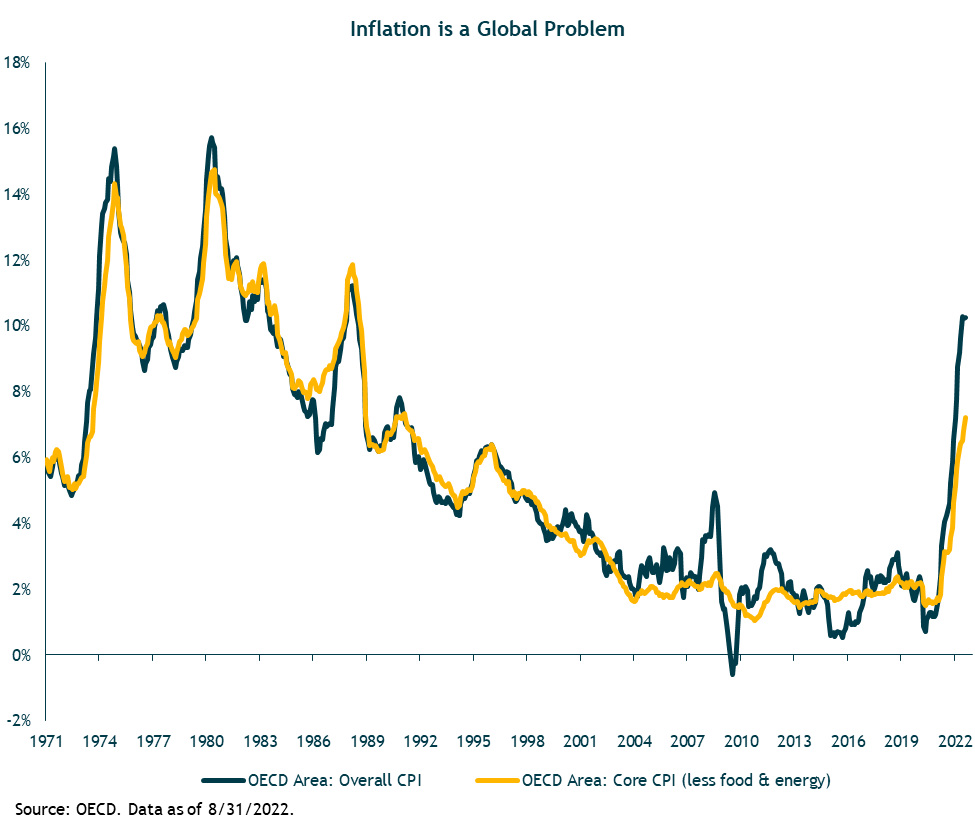
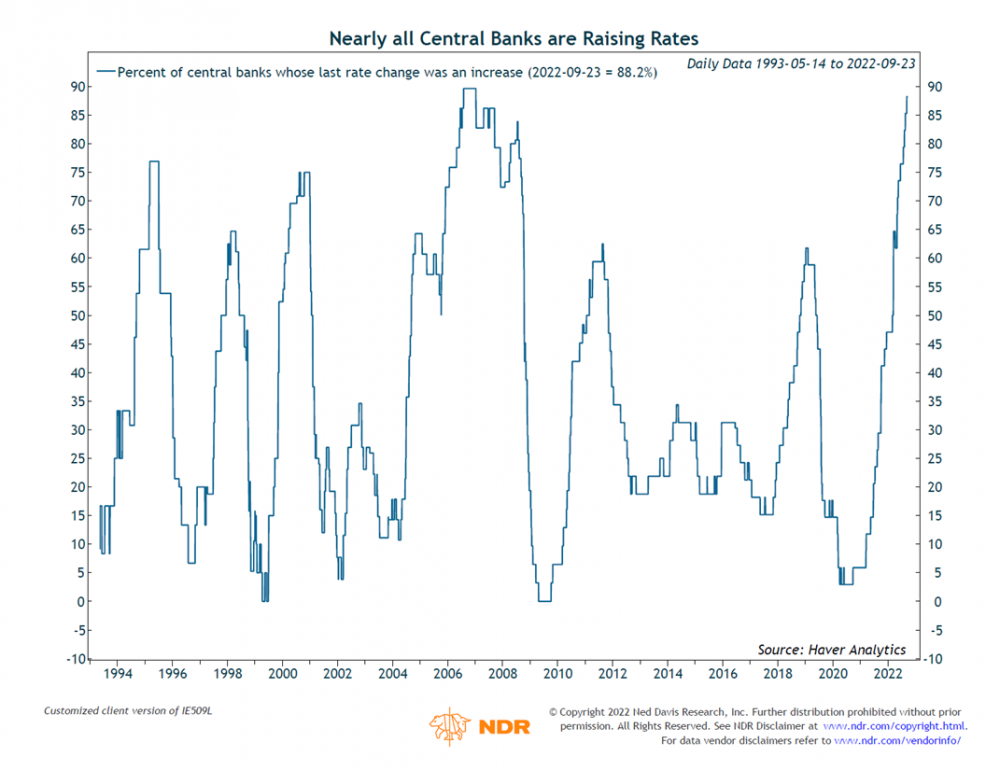
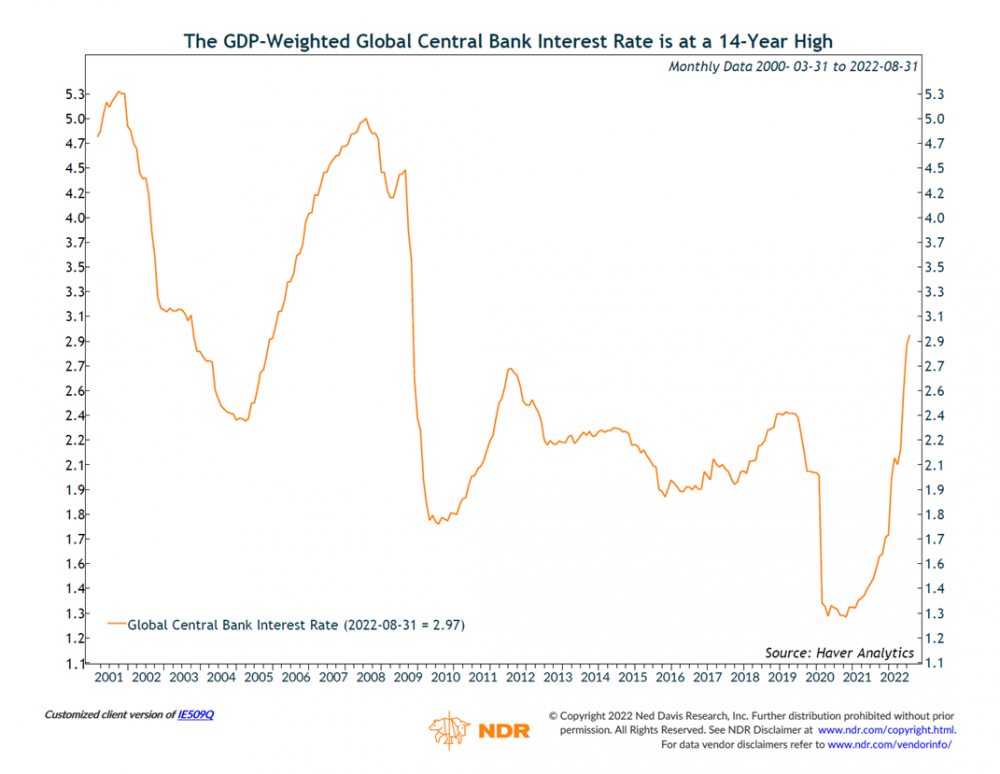
Inflation is not just a U.S. problem. Nearly all global central banks (except Japan and China) are raising their policy rates to fight inflation in their countries. This will depress global aggregate demand and economic growth over the shorter-term.
Economic Growth
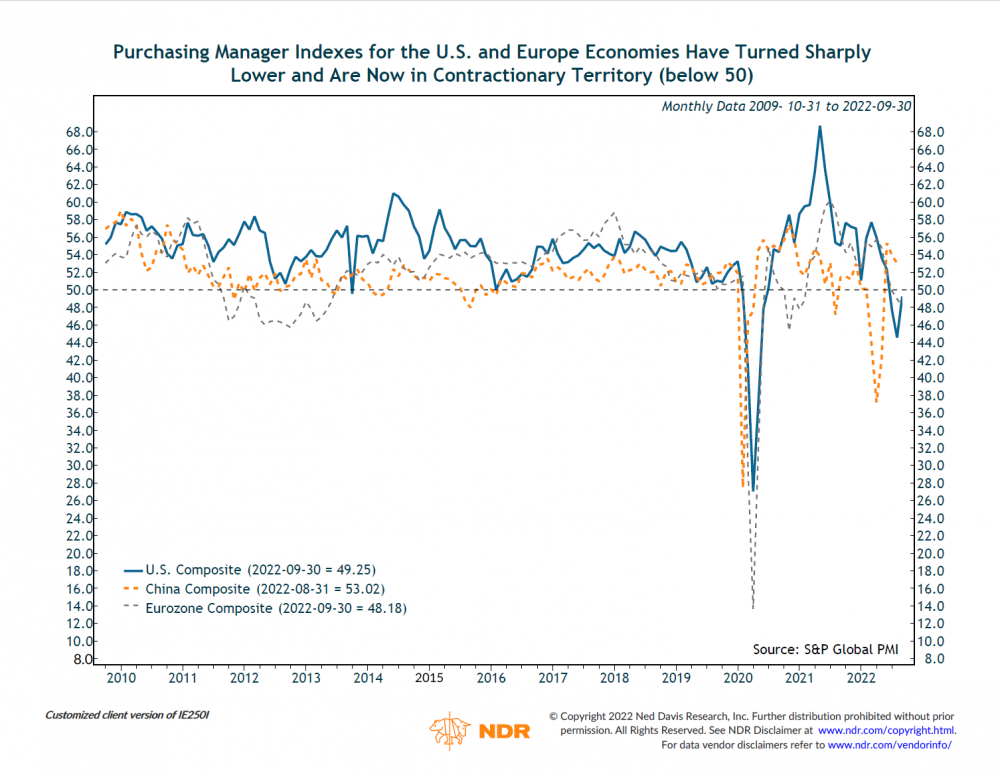
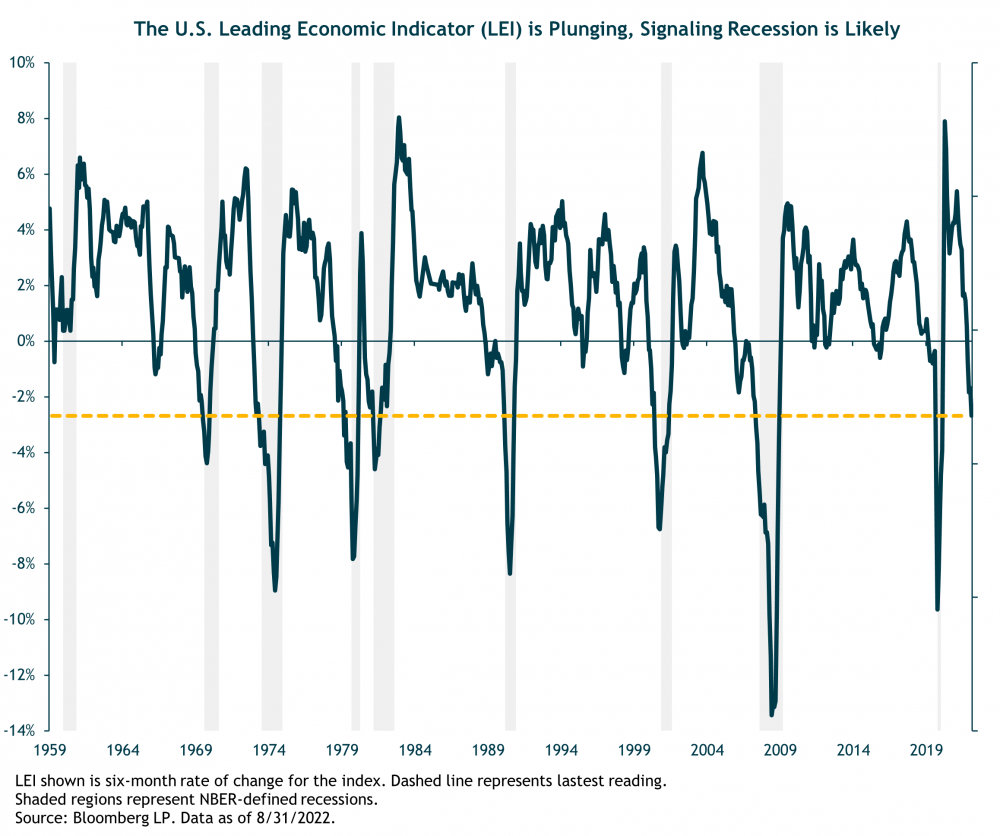
Along with persistent core inflation, the shorter-term growth outlook has worsened for the U.S. and most of the globe. In our Q2 commentary we highlighted two widely followed economic indicators that are published monthly: the Purchasing Manager Indexes (PMI) and the Conference Board’s Leading Economic Index (LEI). Both measures continued to deteriorate in the third quarter and are now signaling a recession is likely coming down the pike.
We put particular weight on the LEI – the “granddaddy of leading indicators.” In addition to the magnitude of its recent decline, the LEI has dropped for six straight months (and will again in September). That has never happened before without a recession.
Of course, no leading indicator is 100% foolproof. There are way too many non-stationary variables that impact economies and financial markets for that to be the case. But the LEI has an excellent track record.
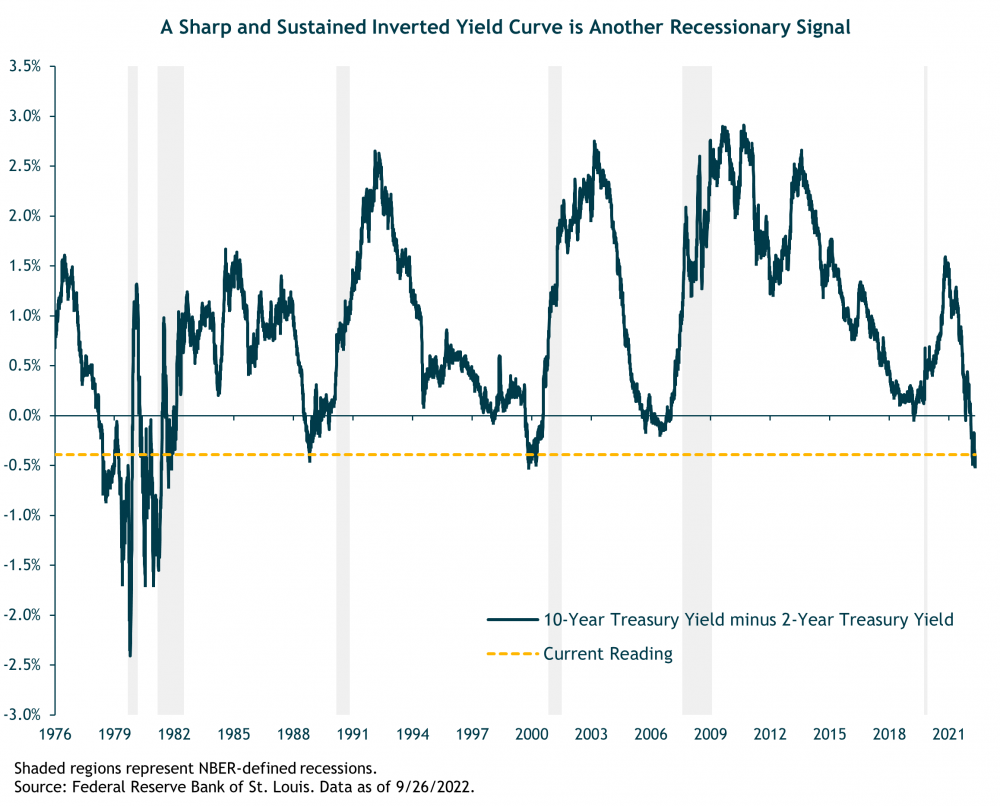
A third time-tested recession indicator is the Treasury yield curve – specifically whether and to what extent it is inverted, meaning shorter-term yields are above longer-term bond yields. An inverted yield curve is unusual and usually a leading indicator of recession. But not always, and the timing from inversion to onset of recession has been highly variable historically. Nevertheless, the 2-year/10-year yield curve is strongly inverted at -50 bps. This degree of inversion has never occurred without a subsequent recession and is another piece of the puzzle that leans recessionary.
Finally, we’ve noted in the past that more important than whether the Fed is raising or cutting the fed funds rate is whether the policy rate is at a “tight” or “accommodative” level. That is, is the fed funds rate above or below the U.S. economy’s long-term “neutral” or equilibrium fed funds rate – where the economy is at full employment and inflation is around 2%?
Unfortunately, the neutral fed funds rate is a theoretical concept that can’t be measured or known with certainty. But it is a key estimated metric for Fed policymakers and economists (two of our favorite groups!). Most agree that the fed funds target rate of 4.4% at year-end and 4.6% by early 2023 are above, if not well-above, the neutral rate. And if those rate levels are not enough to bring down inflation sharply, Powell and the Fed have made it clear they will keep tightening until they get there. The problem is that because monetary policy impacts the economy with long and variable lags, that ideal “tight enough but not too tight” rate level will only be clear in hindsight -- after it’s likely too late to avoid pushing the economy into a recession in the process.
Putting all the macro pieces together, we now see recession as the most likely 12-month base case scenario.
While we weigh the evidence as leaning strongly towards a U.S. recession, there are still some positives supporting the economy and that may mitigate the severity of a recession if/when it happens. To wit: the strong labor market and wage growth supports consumer income and spending; monthly job growth (nonfarm payrolls) has remained robust, increasing by 315,000 in August; weekly new unemployment claims remain very low (though they are ticking higher); there don’t appear to be any major, systemic, economic/financial imbalances (e.g., unlike in 2007-08); and, generally robust household savings and business balance sheets can support additional spending and borrowing.
So again, a recession is not a certainty. A soft landing is still a possibility, with some luck. But we don’t see the current positives as strong enough to offset the economic damage that looms ahead. And to the extent the economy remains strong and the inflationary fire remains stoked, the Fed will have to tighten even more than the markets currently expect. That won’t be good for financial asset prices.
Financial Markets Outlook
Having established our conviction that a recession is likely over a shorter-term (~12-month) horizon, the next step is assessing whether and to what extent the financial markets, and more specifically the U.S. stock market, are pricing in (“discounting”) a recessionary scenario. If the market consensus as reflected in current prices already aligns with our view, then there may be no tactical investment opportunity to act upon and no reason to change our existing portfolio asset allocations.
As always, our assessment is based on a weight-of-the-evidence and multi-scenario approach that incorporates both historical market analysis and forward-looking judgement. We can break down our analysis in this case into three pieces: (1) shorter-term downside risk for the S&P 500 in a recession; (2) relative risk/return of the S&P 500 versus core bonds; and (3) medium-term (five-year) expected returns for the S&P 500, Developed International/Europe, and EM stock markets.
As we write this in late September, our assessment of the evidence is that the S&P 500 is not adequately discounting the likelihood and severity of an oncoming earnings recession.
- Shorter-term S&P 500 Downside Risk Analysis
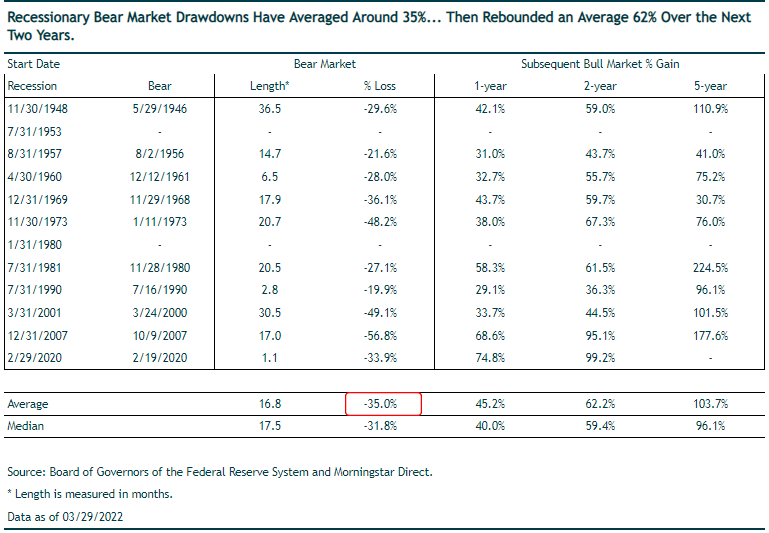
Starting with the simplest analysis, history informs that in post-WWII “recessionary bear markets,” the S&P 500 has had an average peak-to-trough decline of 35%. That would imply the S&P 500 falling to 3100, from its January 2022 high of 4800. So, we don’t believe the market is adequately discounting the recession risk, based on this metric.
From the table on the following page, we can also see that the range of recessionary bear market declines has been very wide, from -20% (in 1990) to -57% (during the 2008-09 financial crisis). As we discussed in our Q2 commentary and noted briefly above, we think a repeat of the severity of the 2008-09 bear market is unlikely because we do not see anywhere near the systemic financial and economic imbalances now compared to then. Nor do we see the degree of “irrational exuberance” that existed prior to the bursting of the tech bubble in 2000 leading to that period’s 49% market drop. But that type of severe peak-to-trough decline is possible, which would imply a downside of around 2450 on the S&P 500.
Economic recessions are typically associated with a significant drop in corporate earnings (negative EPS growth), i.e., an earnings recession. So, a second approach to estimating the potential bear market decline is to estimate the likely impact on corporate earnings and valuations, and then derive the trough S&P 500 level from those estimates.
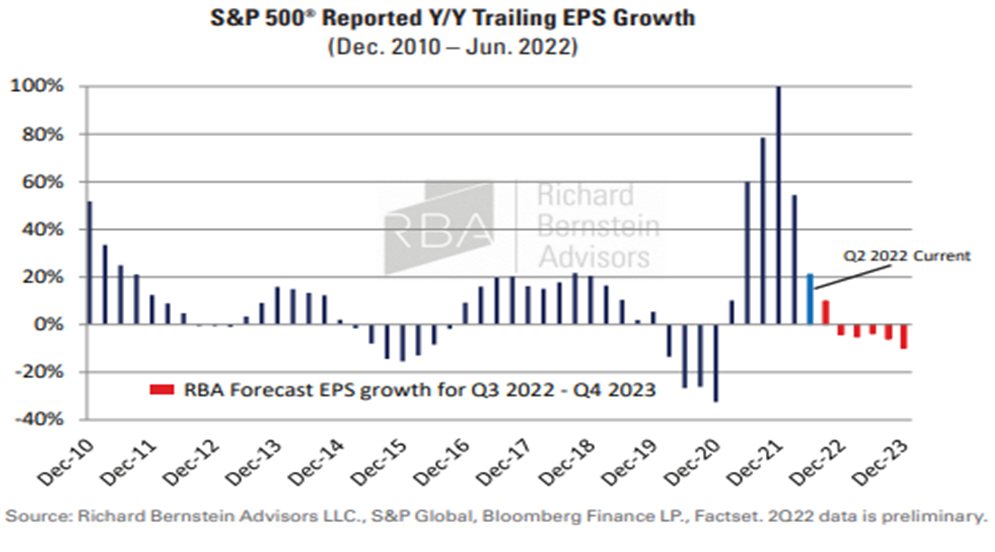
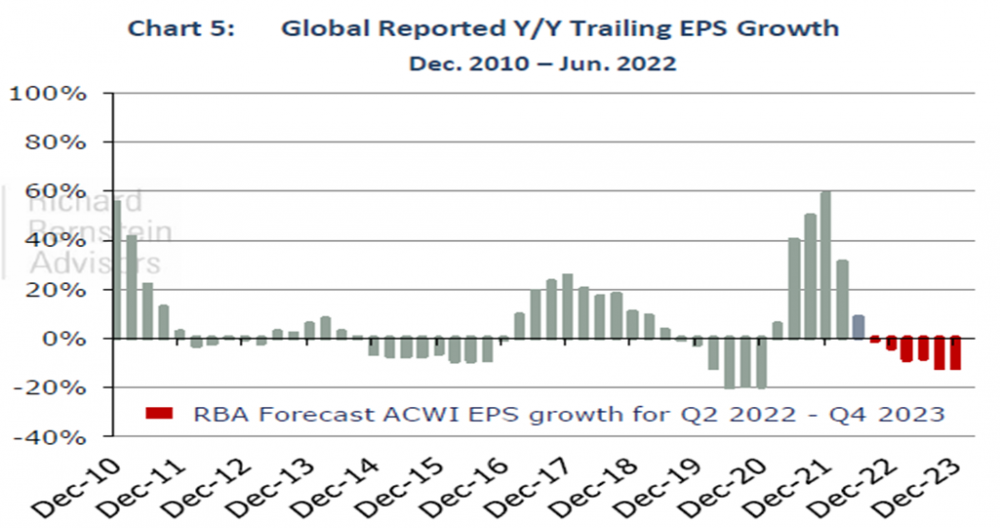
Our internal analysis of historical S&P 500 peak-to-trough earnings-per-share (EPS) declines during post-WWII recessions indicates a median EPS decline of around 20%. We’ve seen analysis from other investment strategists that calculate a 15% average recessionary EPS decline. The charts below, reprinted with permission from Richard Bernstein Advisors (RBA), show RBA’s 12-month forward earnings forecasts for the U.S. and Global equity indexes. RBA is an investment firm we respect that has a long track record of relatively accurate earnings-cycle forecasts. Their current forecasts are for year-over-year EPS declines in the 10-15% range. (RBA is an partner of iM Global Partner).
Taking all these inputs into account, we think assuming a 10-20% EPS decline in our recession base case is reasonable.
If one believes the current Wall Street analyst consensus earnings estimates – and they should be taken with a large grain of salt as they are rarely correct -- the market is clearly not discounting anywhere near that kind of earnings decline next year. Nor any earnings decline for that matter. The current bottom-up consensus estimate is for an 8% increase in S&P 500 Operating EPS for 2023. Analyst earnings estimates for 2023 have started coming down over the past few weeks, but the market is still far from discounting anywhere near a 10-20% earnings decline at its current level.
The other piece of our analysis is to apply a P/E valuation multiple to our estimated range of trough 2023 earnings. Again, given how variable P/E ratios are, we consider a range of reasonably likely P/Es, rather than betting on a single outcome. We think a trailing 12-month GAAP P/E range of 16x to 19x is reasonable in the current situation.
Putting it all together we derive the following matrix of the peak-to-trough S&P 500 percentage price decline in our shorter-term recessionary base case, assuming EPS declines 10-20% and P/E ranges from 16x to 19x.
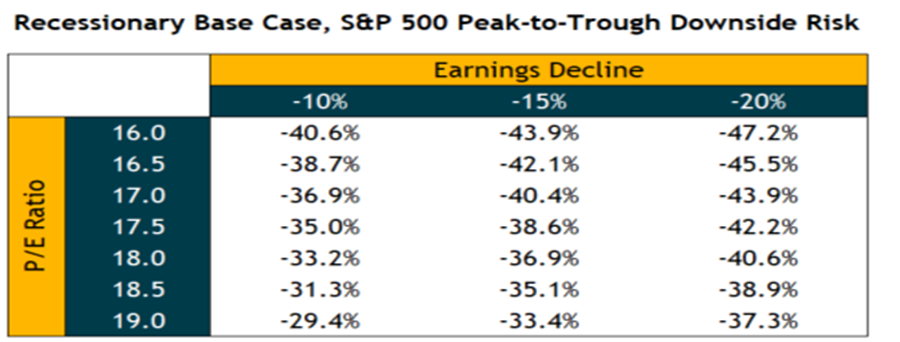
Narrowing the range a bit more from the matrix, we estimate potential shorter-term downside for the S&P 500 from its January high in the range of -33% to -44%. This corresponds to an S&P 500 level of 2700 to 3200. This range also encompasses the simple historical average 35% peak-to-trough recessionary bear market decline.
-
2. Relative Attractiveness of Stocks Versus Bonds
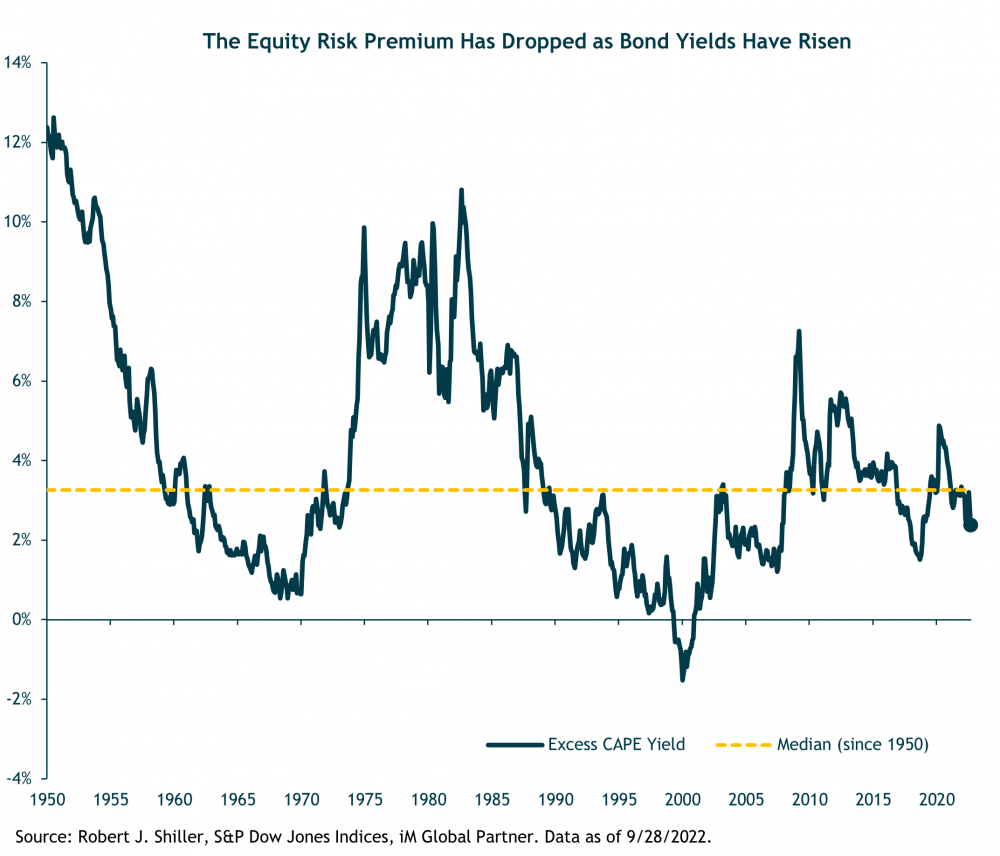
The second piece of our market assessment is to compare the current relative attractiveness of stocks vs. bonds. For a while we have argued that while U.S. stocks have not looked compelling on an absolute expected-return and valuation basis, they were still relatively reasonably attractive compared to the extremely low yields on core bonds. Put differently, the extra earnings yield we expected to earn on stocks compared to core bonds – the “equity risk premium” -- was sufficiently high to somewhat favor equities.
However, with the sharp rise in core bond yields this year – to above 4% -- that has changed. Stocks no longer look cheap relative to bonds, as can be seen in the chart below. They are around their long-term average equity risk premium relative to bonds.
With their higher current yield, core bonds now also offer better portfolio ballast and shorter-term return potential in a recession scenario. For example, if the 10-year Treasury yield were to decline 75 bps (to 2.75%) over the next 12 months, we estimate the core bond index (the Agg) would return roughly 8% (from yield plus price gains). That would be in the neighborhood of a 30 percentage point advantage versus the equity market if stocks are down 20%-plus from here. Even if Treasury yields rise 75 bp from here, for example in a “stagflationary recession” scenario, we estimate the Agg Bond Index total return would still be slightly positive, around 1%.
-
3. Five-year Expected Returns for Global Equities and Core Bonds
The third and final piece of our weight-of-the evidence market assessment is our analysis and estimation of five-year (medium-term, tactical) expected returns for stocks and bonds.
During the past few months, our research team updated our key equity and fixed-income market assumptions that drive our five-year expected returns modeling. We will discuss these changes at a fairly high level here. For those interested in more of the gory details, we refer you to the individual asset class write-ups on AdvisorIntelligence to be published in October.
Global Equities: Cutting to the chase, our updates resulted in lower five-year expected return estimates for U.S., Europe, and Emerging Market (EM) equity markets across our Base Case, Downside/Bear and Upside/Bull scenarios.
For the U.S., this was primarily due to lowering our S&P 500 net profit margin assumption (five years from now) by two percentage points compared to our prior margin assumptions. We still believe S&P 500 net margins will far exceed their 50-year average of 6.4% as a function of the changed composition of the S&P 500 towards higher-margin businesses. But we think there will be some reversion from their current level of 11.6% and their all-time high of 12.6% at the end of 2021. In our five-year Base Case scenarios, we now assume net profit margins in the 9-10% range.
We did not change our five-year-forward S&P 500 sales growth assumptions, nor our S&P 500 “shareholder yield” assumption (equal to the S&P 500’s dividend- plus buyback-yield).
For valuations, we reduced our Base Lower scenario P/E by one multiple point, from 20x to 19x, to account for what we believe is likely to be somewhat higher real interest rates and inflation over the next five years. All else equal, higher real yields should imply lower valuation multiples.
The following table shows our updated five-year expected returns for the U.S., Europe, and EM equity indexes. For U.S. stocks our Base Case return estimate ranges from 3.9% to 10.1%, with a central tendency of 7%. The expected return is essentially the sum of the three key components: (1) the S&P 500’s shareholder yield (roughly 2.6%); (2) the annualized percentage change in the P/E valuation multiple between now and our P/E assumption five years from now; and (3) the implied S&P 500 EPS growth rate over the next five years, which we derive from our sales growth and profit margin assumptions.
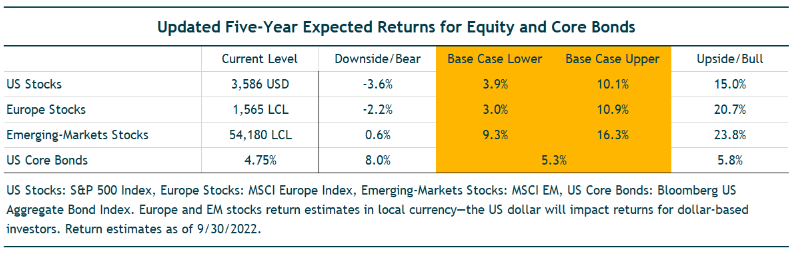
Estimated returns are annualized and generated by iMGPFM. This table shows our five-year, annualized asset class return estimates across several broad macroeconomic scenarios we believe are possible. Collectively, the scenarios encompass the range of outcomes we believe are reasonably possible and therefore worth considering in creating our portfolio allocations. We make assumptions for various fundamental and valuation metrics we believe are consistent for each asset class within each macro scenario then incorporate current prices to generate an estimated return. The macroeconomic scenarios and estimated returns can change. When this happens, we will clearly note it and give guidance on new estimates. See “Estimated Returns Disclosure” at the end of this commentary for more information on macro scenarios and fundamental/valuation metrics used in the analysis.
This is a decent expected return range for an environment with average U.S. equity risk. But it’s too low an expected return given our conviction that an earnings recession is likely over the shorter-term with significant downside for stocks, and in light of the more attractive relative returns likely from bonds, thanks to higher yields plus core bonds’ superior downside protection.
In sum, as we weigh the trade-off between short-term downside risk management (playing defense) and medium-term upside return potential (playing offense) we want to shift our portfolios towards more defense right now and we do not believe we are giving up return in doing so. When the equity market declines to levels that offer compelling medium-term returns – which typically happens during a recession when investor pessimism and fear are rampant – we will look to play more offense.
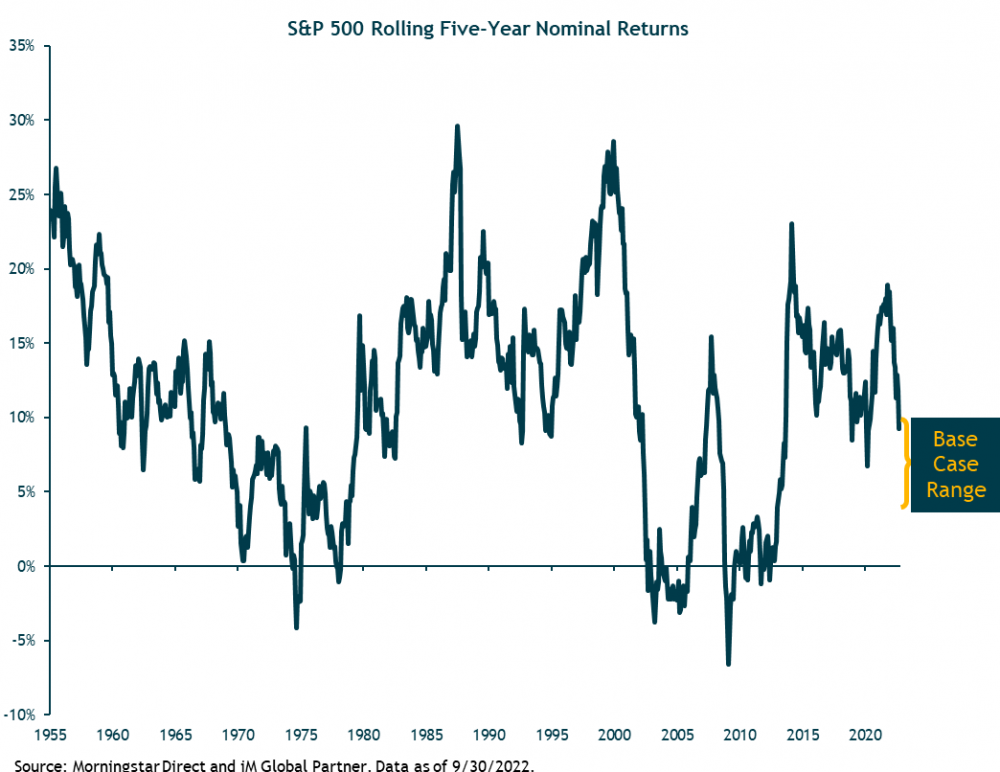
For historical context, the chart below shows actual rolling five-year nominal returns for the S&P 500 since 1955. The average five-year return has been 11.2%. The worst five-year annualized return was during the low point of the financial crisis in February 2009, at -6.6%; second worst was -4.2% in September 1974 during another severe bear market.
We also updated our five-year sales growth, profit margin and valuation assumptions for Europe and EM stock markets. Their five-year expected returns also came down, roughly by similar percentages as the U.S. As of quarter-end, the EM Base Case expected return range is 9.3% to 16.3% with a 13% central tendency.
This is a reasonably attractive return range in absolute terms given EM equity risk. And it still implies significant added return potential relative to U.S. stocks and core bonds over the medium-term horizon. Our five-year estimates also do not include any added return benefit for dollar-based investors in EM and international stocks if the dollar depreciates from its current 20-year highs, as we expect.
In the shorter-term, however, these markets could suffer similar downside as the U.S. market in a recessionary scenario. The dollar could also further strengthen in the near-term as the Fed raises rates and the global economy slows.
Bonds: On the fixed-income side, our updated Base Case macro scenario assumes somewhat higher nominal Treasury yields and inflation than we had previously assumed, but still very low real yields in the 0% to 1% range. This results in a five-year annual expected return of nearly 4% for the Agg Bond index.
The Downside/Bear scenario for stocks assumes a depressed earnings, valuation, and deflationary environment. This would be a strongly positive scenario for core bonds as we assume nominal 10-year yields drop sharply, to levels consistent with their lows in the decade prior to the pandemic.
A different type of Downside scenario for equities and core bonds would be a highly stagflationary environment, like what we’ve experienced this year, with rising rates and high inflation crushing bond prices, and falling valuation multiples and compressed profit margins hurting equities. Based on central banks’ current aggressive response to inflation, we see this type of 1970s replay as unlikely. But our updated Base Case scenario moves incrementally in that direction, assuming higher inflation and interest rates and lower profit margins than in the past decade.
Portfolio Positioning and Tactical Portfolio Changes
Putting it all together, the weight of the evidence – the high risk of a near-term earnings recession that creates risk for further equity declines, combined with equity valuations that aren’t attractive relative to core bonds with their now meaningfully higher yields (and downside protection) -- leads us to make the following tactical portfolio changes. We are reducing the equity exposure in our balanced portfolios by 2% to 5% depending on the portfolio risk objective, and adding to core bonds. We are also unwinding our long-standing tactical position in floating-rate loan funds, which had been funded out of core bonds, and reinvesting the proceeds back into core bonds.
After these changes most of our balanced portfolios will have a slight underweight to global equities overall relative to our strategic benchmarks. EM equities will have a lower but still modest overweight, depending on the portfolio.
Our portfolios have been meaningfully underweight core bonds for quite some time due to our low return expectations and meaningful interest-rate risk. This year, core bonds have suffered one of their worst declines in history as rates have surged to what are now reasonable levels on a medium-term basis and attractive in a shorter-term recessionary scenario. Our core bond allocations will now increase, funded from the reduction in stocks and liquidation of the floating-rate loan tactical allocation. For what it’s worth, floating-rate loans have been one of the best-performing fixed-income asset classes this year, declining approximately 2% compared to a 14% loss for the Bloomberg Aggregate Bond Index. Moreover, the allocation to loans was a significant outperformer over our long-term holding period.
The timing of our decision to sell loans is being driven primarily by portfolio-construction considerations -- to increase recessionary ballast. Loans do not provide the same level of protection as core bonds during “risk-off” markets. We estimate they could lose a couple percent in a 12-month recessionary scenario. Fundamentally, we think the loan universe is generally healthy, but the risk of downgrades and higher defaults is increasing, both of which would be headwinds for the asset class. As we evaluate risk-reward, loans could continue to perform well, but by rotating out of loans we don’t think we’re giving up much upside even if rates rise further, while meaningfully improving downside protection.
While core bonds have become more attractive given their higher yield, we continue to have a meaningful allocation to actively managed flexible bond funds, run by experienced teams with broad investment opportunity sets. There are many fixed-income sectors outside of core bonds that offer attractive risk-return potential, and we want to access those via our selected active managers.
Finally, we maintain our core positions in trend-following managed futures funds. Managed futures returns have been hugely positive this year as traditional bond and stock funds have plunged. These alternative funds, with their alternative sources of return and risk, should continue to provide tactical and longer-term strategic benefits to our balanced portfolios. They are much less dependent than traditional investments on which type of macro environment (e.g., deflation, stagflation, inflation, or goldilocks) unfolds over the coming years.
Closing Thoughts
From a macroeconomic perspective, U.S. core inflation remains stubbornly high. In response, the Federal Reserve continues to implement aggressive monetary policy tightening and is unlikely to stop until there is clear and consistent evidence that inflation is falling towards their 2% target. This will take a while and there is a good chance, given the long lags for the effects of monetary policy to fully flow through the economy, that the Fed will tighten too much. We’ve seen this movie before and we don’t want to fight the Fed.
As such, we see an increasingly high risk of an economic and earnings recession over a shorter-term (12-month) horizon. This is now our shorter-term base case expectation.
Our financial markets analysis indicates that in a recessionary bear market the S&P 500 could reasonably fall anywhere from 33% to 44% below its January 2022 high; this would put the S&P 500 in the 2700 to 3200 range at its trough for this cycle. Of course, higher or lower outcomes are certainly possible, but this is our current baseline expectation.
While equity markets have sold off over the past several weeks from their mid-summer highs, we do not believe their current levels adequately discount this earnings recession risk.
In the meantime, core bond yields have risen materially this year (the Agg Bond Index is yielding above 4%), to the point where equities are no longer relatively cheap versus bonds.
When we weigh the shorter-term equity market downside risks and our medium-term (five-year) return expectations across the wide range of scenarios we believe are reasonably probable, we think it makes sense to tactically reduce equity and credit risk in favor of now higher core bond yields along with their better defensive characteristics.
Therefore, we are making tactical portfolio changes. We are reducing our global equity allocation by 2% to 5% depending on the portfolio and eliminating our tactical allocation to floating-rate loans. We are moving the proceeds back into core bonds for additional recessionary ballast.
We continue to hold allocations to flexible actively-managed bond funds and alternative strategies/funds, including a core holding in trend-following managed futures. We also have a small overweight to EM equities in most of our portfolios based on EM’s significantly higher five-year expected returns compared to U.S. stocks and bonds.
Regards,
Jeremy DeGroot, CIO US Asset Management
iM Global Partner
Note: For discretionary use by investment professionals. This document is provided by iM Global Partner Fund Management, LLC (“iMGPFM”) for informational purposes only and no statement is to be construed as a solicitation or offer to buy or sell a security, or the rendering of personalized investment advice. There is no agreement or understanding that iMGPFM will provide individual advice to any investor or advisory client in receipt of this document. Certain information constitutes “forward-looking statements” and due to various risks and uncertainties actual events or results may differ from those projected. Some information contained in this report may be derived from sources that we believe to be reliable; however, we do not guarantee the accuracy or timeliness of such information. Investing involves risk, including the potential loss of principal. Any reference to a market index is included for illustrative purposes only, as an index is not a security in which an investment can be made. Indexes are unmanaged vehicles that do not account for the deduction of fees and expenses generally associated with investable products. A list of all recommendations made by iMGPFM within the immediately preceding one year is available upon request at no charge. For additional information about iMGPFM, please consult the Firm’s Form ADV disclosure documents, the most recent versions of which are available on the SEC’s Investment Adviser Public Disclosure website (adviserinfo.sec.gov) and may otherwise be made available upon written request.
Estimated Returns Disclosure
Scenario Definitions:
Downside: The economy falls into a deep and sustained recession for any of various reasons, such as deleveraging/deflation, unexpected systemic shock, geopolitical conflict, Fed or fiscal policy error, etc. At the end of our five-year tactical horizon, S&P 500 earnings are below their normalized trend and valuation multiples are below-average reflecting investor risk aversion. Inflation and 10-year Treasury nominal and real yields are very depressed.
Base: Consistent with long-term economic and market history, reflecting economic and earnings growth cycles that are interspersed with recessions around an upward sloping normalized growth trendline. Inflation is at or moderately higher than the Fed’s 2% target level and 10-year Treasury real yields are around zero percent to slightly positive. For the S&P 500, we now bookend our base case with a lower-end and upper-end estimate:
- At the lower end of our base-case fair-value range, reflation efforts are successful and nominal economic growth is higher than the average. However, the economy overheats, and valuation multiple and some margin compression largely offset the favorable macro backdrop.
- At the upper end, reflation efforts are also successful, nominal economic growth is higher than observed since the 2008 financial crisis on average, profit margins move slightly higher, and valuation multiples are also slightly higher than the recent historical average.
Upside: S&P 500 earnings end the period well above their long-term (base case) normalized trendline. Valuation multiples are well above average and higher than the upper end of our base case. The Fed exits its accommodative policy without major economic or market disruptions, although a normal recession within the five-year period is still possible. Inflation is around or moderately higher than the Fed’s 2% average target. Real 10-year Treasury yields are around zero percent to negative as the Fed succeeds in keeping rates from materially rising.
What the Table Shows: Our five-year, annualized asset class return estimates under several broad economic scenarios. Collectively, the scenarios we use encompass the range of outcomes we believe are reasonably possible and therefore worth considering in creating our portfolio allocations.
Why We Use Scenarios: Considering how each asset class might react under a consistent set of scenarios allows us to calibrate our return expectations across asset classes. We believe this helps us make better asset allocation decisions.
These Scenarios Can Change: As the overall economic environment changes it will at some point necessitate changes to the scenarios we consider. Therefore, there could be times when we are reassessing scenarios and temporarily suspend providing updates for one or more scenarios. When this happens, we will clearly note it and give guidance on when we expect to complete this process.
Any projections provided regarding the likelihood of various investment outcomes are hypothetical in nature, do not reflect actual investment results and are not guarantees of future results. Investing involves risk, including the potential loss of principal, and investors should be guided accordingly.
Related research

iMGP DBi Managed Futures Strategy ETF Update with Andrew Beer | October 2023
In this new video update, Andrew Beer covers topics including September performance, portfolio rot ...

Impact of the Silicon Valley Bank Failure
Recent problems in the banking industry have increased uncertainty in the financial markets. In th ...

Year-End 2022 Investment Commentary
An extremely difficult year in the financial markets ended with a thud for U.S. stocks. After a 14 ...