Questions About Managed Futures Allocations
We frequently get the questions from advisors and clients, “How much should I allocate to managed futures and how should I fund the allocations?” Answering this brings to mind a quotation, attributed to a range of people from Yogi Berra to Albert Einstein. It goes, “In theory there is no difference between theory and practice. In practice there is.” That encapsulates the challenge advisors face when thinking about managed futures, even once they’ve made the decision that the strategy deserves a place in a portfolio. There are real behavioral reasons why people may not be comfortable with managed futures, but statistically and empirically, after this year especially, we don’t think there’s a strong argument against including managed futures. However, when going back to the implementation issues, for most advisors, theory and practice are only loosely related. We try here to provide some guidance that may help in these considerations.
Executive Summary
- Because managed futures have the potential to bring diversification benefits to a portfolio, based on the statistics, you should hold about as much in managed futures as you can confidently defend when the strategy isn’t performing well. (Almost no one allocates as much as an optimizer would suggest.)
- Despite the potential long-term benefits, managed futures can sometimes be frustrating for extended stretches. Sizing them appropriately is important.
- A managed futures allocation should be big enough to move the needle in your portfolio when it’s working, otherwise the inevitable challenging periods along the way will hardly be worth it.
- But the allocation can’t be so big that you (or your client) will throw in the towel during rough patches.
- The best asset allocation is one that you can stick to for the long term, including through down periods for every component asset class or strategy.
- We believe an allocation to managed futures in the 5% to 10% range is the practical sweet spot for most balanced portfolio investors (although higher allocations are well supported by the statistics).
- We’d fund the allocation from roughly a pro rata mix of stocks/bonds, or for more risk-tolerant investors, somewhat more from bonds given equities’ higher expected long-term returns.
Impact of adding managed futures to a balanced portfolio
If you look at adding managed futures pro rata to a 60/40 portfolio at various allocation levels, starting with 5% managed futures and increasing at 5 percentage point increments up to 25% managed futures (1/1/2000 through 9/30/2022, rebalancing annually), each additional notch higher in the managed futures allocation modestly increases returns since inception, and significantly decreases the portfolio’s standard deviation, thus also materially increasing risk-adjusted return measures (i.e., the Sharpe Ratio and Sortino Ratio). [1]
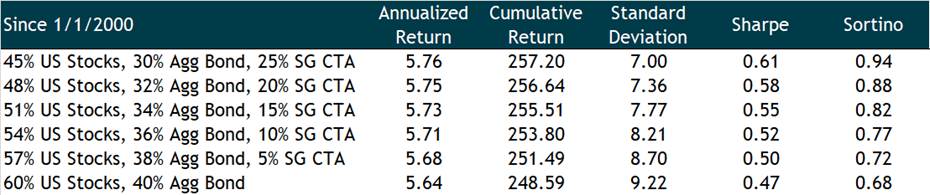
Source: Morningstar Direct. Data as of 9/30/22.
Indexes are unmanaged and cannot be invested into directly.
*These hypothetical returns are provided for educational purposes only and do not reflect actual trading for any account, portfolio or strategy managed by any investment adviser. These returns do not reflect the deduction of any fees or expenses that you would pay in connection with an investment, including any fees charged by your financial advisor and any expenses that you would indirectly pay if you invest in funds that track the indices. Such fees and expenses would cause any actual returns to be lower than the hypothetical returns presented herein. See the “Disclosures” at the end of this document for important information regarding the returns presented herein and the risks and limitations of using hypothetical performance in making investment decisions.
These measures are impressive, but --to mangle an investment adage-- you can’t eat Sharpe Ratio. The investor/client experience is usually driven much more by absolute numbers, positive or negative. Looking at the reduction in drawdowns in various crisis periods may be the most valuable way to understand the real-life implications of a managed futures allocation.
Below we show the reduction in drawdowns of a 60/40 portfolio with the managed futures combinations, using as examples the bear market following the Tech Bubble (2000-02); the Global Financial Crisis bear market (2007-09); and the current inflation/rate-driven bear market. Historical episodes hopefully have some resonance with clients, but there’s nothing quite the same as actually living through a bear market like the current one to reinforce the power of diversifying strategies.
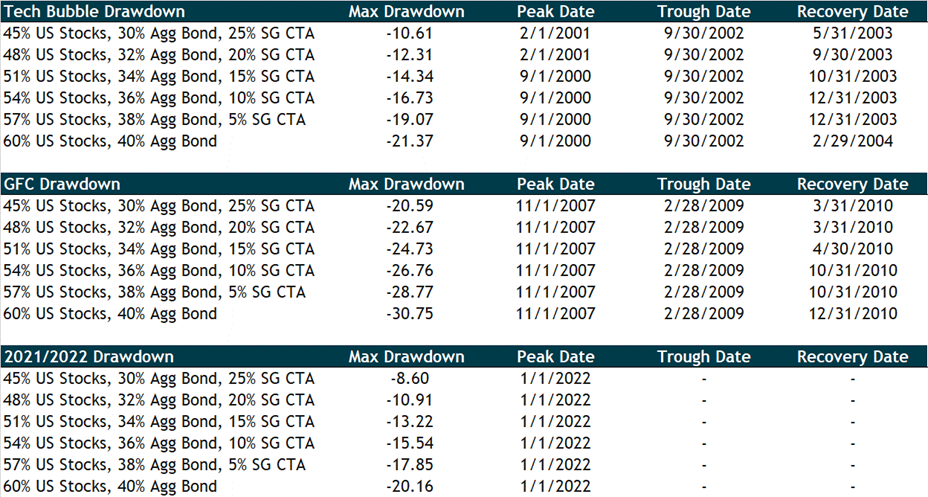
Source: Morningstar Direct. Data as of 9/30/22.
Indexes are unmanaged and cannot be invested into directly.
*These hypothetical results are provided for educational purposes only and do not reflect actual trading for any account, portfolio or strategy managed by any investment adviser. These results do not reflect the deduction of any fees or expenses that you would pay in connection with an investment, including any fees charged by your financial advisor and any expenses that you would indirectly pay if you invest in funds that track the indices. Such fees and expenses would cause any actual results to be lower than the hypothetical results presented herein. See the “Disclosures” at the end of this document for important information regarding the results presented herein and the risks and limitations of using hypothetical information in making investment decisions.
Once again, the numbers are impressive. Even a small 5% allocation to managed futures would have saved you about 2.3 percentage points of performance this year – from a loss of 20.2% to 17.9%. A “bold” 10% allocation would have come close to cutting losses by a quarter! [2]
How much should you allocate to managed futures?
The answer doesn’t come from looking at an optimizer. If the goal is increasing risk-adjusted returns, an optimizer would tell you to allocate more than any client or advisor we’ve met is comfortable with, typically in the range of one-third of the portfolio [3] with some variation higher or lower depending on the measurement period. This is one case where the decision should clearly be based on more than numbers. The practical constraint on sizing allocations to highly diversifying strategies like managed futures tends to be how much of your portfolio you (or your clients) are comfortable holding in an unconventional strategy that’s “not working,” potentially for an extended period. This can be particularly challenging during periods when traditional, simple, easy-to-understand stocks and bonds are doing well at the same time managed futures are struggling.
Why would an optimizer tell you to invest so much in managed futures? Simply put, because the strategy (as measured by the SG CTA Index) has similar long-term returns to a 60/40 portfolio [4], but with essentially zero long-term correlation to both stocks and bonds: -0.09 correlation to the S&P 500 Index from January 2000 through September 2022, and 0.08 correlation to the Bloomberg Aggregate Bond Index (using monthly returns). Rolling 12-month correlations range between about -0.8 and +0.8 for both, with the potential for dramatic shifts over short timeframes. This makes intuitive sense given the potential for managed futures to be long or short any asset class. The combination of the potential for long-term positive returns with no correlation (and a propensity to perform well during market dislocations) makes the strategy a potentially valuable addition to a portfolio.
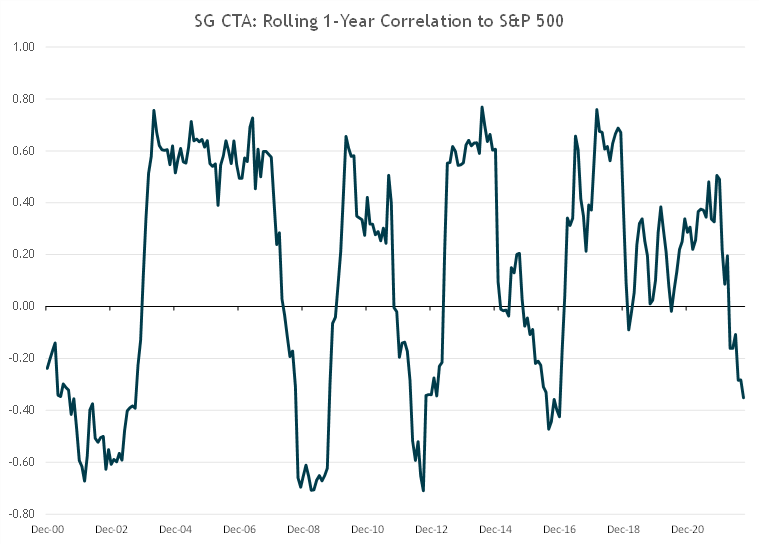
Source: Morningstar Direct. Data as of 9/30/22.
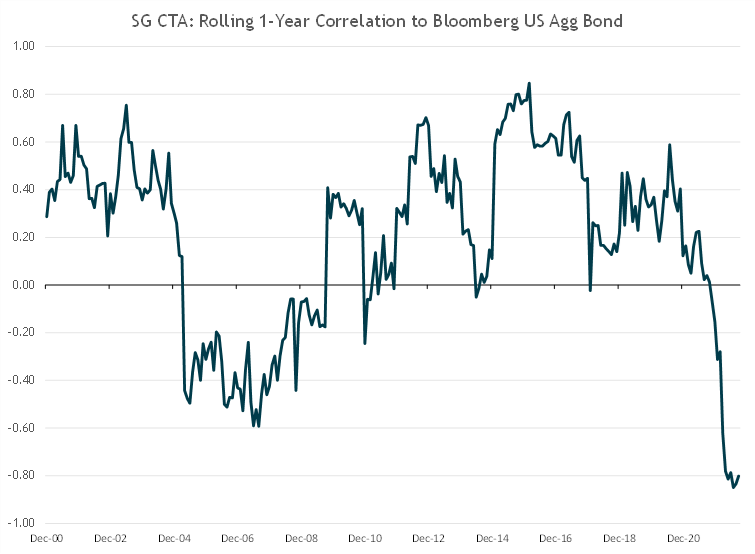
Source: Morningstar Direct. Data as of 9/30/22.
How should you fund a managed futures allocation?
Because managed futures have essentially no long-term correlation to anything, it makes sense to fund them pro rata from an existing allocation. The existing allocation has presumably been “optimized” for the investor’s return goals and risk tolerance based on the performance and correlation characteristics of its underlying components. Funding pro rata from these sources should preserve the potential return profile of the portfolio’s core, while adding the diversification benefits and (likely) crisis alpha of managed futures.
A reasonable case could also be made to fund an allocation more than pro rata from bonds, given stocks outperform bonds over long time horizons, and managed futures tend to perform well during extended stock market weakness (i.e., periods of weeks to months, not days to weeks). The “optimal” allocation depends on what is being optimized (risk-adjusted returns, potential maximum total return, etc.). For a client that is more concerned with risk from a specific asset class, or has some other consideration, the funding sources could of course be customized further according to individual circumstances.
Opportunity costs should factor into this calculus, particularly as an allocation becomes larger. To pick an extreme (and unrealistic) example for effect, if a managed futures allocation was funded entirely from equities beginning in 2015, the opportunity cost of that decision would have been huge over the next five years, as managed futures were essentially flat cumulatively, while the S&P 500 was up over 70% and a 60/40 portfolio was up almost 50%. One could of course find counterexamples, but the point is simply that the further one moves away from pro rata funding, the more it becomes an active “bet” against existing asset allocation, and the greater the chance of an extreme outcome that could derail an otherwise successful investment plan.
Conclusion
The long-term numbers tell us that if maximizing risk-adjusted returns is your goal [5] , you should hold about as much in managed futures as you can confidently defend to yourself or a client when the strategy isn’t performing well. As we have experienced many times during the 7+ years we have been investing in managed futures, they can be frustrating for extended stretches before working. This leads to two conclusions. First, the familiar, almost trite (but true) reminder that the best asset allocation is one that you can stick to for the long term. Second is the recommendation that a managed futures allocation should be big enough to move the needle in your portfolio when it’s working, otherwise the inevitable challenging periods along the way will hardly be worth it. But, the allocation can’t be so big that you (or your client) will throw in the towel during rough patches. It can be a tricky needle to thread, but one that we believe is well worth it when considering the long-term benefits to a portfolio. We believe an allocation to managed futures in the 5% to 10% range is the practical sweet spot for most balanced portfolio investors. We’d fund the allocation from roughly a pro rata mix of stocks/bonds, or for more risk-tolerant investors somewhat more from bonds given equities’ higher potential long-term returns.
Note: For discretionary use by investment professionals. This document is provided by iM Global Partner Fund Management, LLC (“iMGPFM”) for informational purposes only and no statement is to be construed as a solicitation or offer to buy or sell a security, or the rendering of personalized investment advice. There is no agreement or understanding that iMGPFM will provide individual advice to any investor or advisory client in receipt of this document. Certain information constitutes “forward-looking statements” and due to various risks and uncertainties actual events or results may differ from those projected. Some information contained in this report may be derived from sources that we believe to be reliable; however, we do not guarantee the accuracy or timeliness of such information. Investing involves risk, including the potential loss of principal. Any reference to a market index is included for illustrative purposes only, as an index is not a security in which an investment can be made. Indexes are unmanaged vehicles that do not account for the deduction of fees and expenses generally associated with investable products. A list of all recommendations made by iMGPFM within the immediately preceding one year is available upon request at no charge. For additional information about iMGPFM, please consult the Firm’s Form ADV disclosure documents, the most recent versions of which are available on the SEC’s Investment Adviser Public Disclosure website (adviserinfo.sec.gov) and may otherwise be made available upon written request.
Definitions
Standard Deviation: A statistical measure of the historical volatility of a mutual fund or portfolio.
Sharpe Ratio: A measure of risk-adjusted return that represents the number of units of excess return generated per unit of risk (standard deviation) over the trailing period.
Sortino Ratio: A measure of risk-adjusted returns that represents the number of units of excess return generated per unit of downside risk (downside deviation) over the trailing period. Refines the Sharpe ratio to only penalize returns for downside volatility.
Max Drawdown: A maximum observed loss from the peak of the portfolio to the bottom before the new peak is reached. A measure of downside risk over a specified period.
S&P 500 Index: consists of 500 stocks that represent a sample of the leading companies in leading industries. This index is weighted by float-adjusted market capitalization and is widely regarded as the standard for measuring large-cap U.S. stock market performance.
The Bloomberg Barclays U.S. Aggregate Bond Index: is a market capitalization-weighted index, meaning the securities in the index are weighted according to the market size of each bond type. Most U.S. traded investment grade bonds are represented. The index includes US Treasury Securities (non TIPS), Government agency bonds, Mortgage backed bonds, Corporate bonds, and a small amount of foreign bonds traded in U.S.
The SG CTA Index: is an index published by Société Générale that is designed to reflect the performance of a pool of Commodity Trading Advisor (CTAs) selected from larger managers that employ systematic managed futures strategies. The index is reconstituted annually.
Disclosures
The hypothetical performance results shown above have been prepared by iM Global Partner Fund Management (the “Adviser”). The hypothetical performance results do not reflect actual trading; do not reflect the deduction of management fees, trading costs or any other expenses; and do not represent, and are not necessarily indicative of, the results that may be achieved by the Adviser or any investor in a fund or account managed by the Adviser.
The Adviser does not represent that the hypothetical performance results are similar to what the performance would have been had the Adviser actually been managing a similar strategy. Since the hypothetical performance is fictional, there can be no assurance that a client would have achieved similar returns over the same time periods. There are frequently material differences between hypothetical performance results and actual results achieved by any investment strategy.
The hypothetical performance results were calculated by adding managed futures to a standard 60/40 balanced portfolio using different weightings to illustrate the impact managed futures could have on a traditional portfolio allocation.
Hypothetical performance results such as those shown above have many inherent limitations. Unlike an actual performance record, hypothetical results do not represent actual trading and, accordingly, the results may have under- or over-compensated for the impact, if any, of certain factors. The methodology used to calculate the hypothetical performance was designed with the benefit of hindsight. There are frequently sharp differences between the hypothetical performance results and the results subsequently achieved by any particular investment strategy. The Adviser makes no representation that a fund or account managed by the Adviser in accordance with the parameters in this presentation would achieve profits or losses similar to those reflected in the hypothetical performance results shown herein.
Hypothetical performance does not involve financial risk, and no hypothetical trading record can completely account for the impact of financial risk in actual trading (e.g., the ability to adhere to a particular investment strategy in spite of trading losses and the fact that an actual portfolio may not be fully invested at all times). In particular, hypothetical performance may not reflect the impact that material economic and market factors might have had on the Adviser’s decision-making if the Adviser had actually been managing a client’s account. There are numerous other factors related to the markets in general or to the implementation of any specific investment strategy which cannot be fully accounted for in the preparation of hypothetical performance results. All of these factors can adversely affect actual trading results.
[1] We start to see diminishing marginal benefits to annualized returns at a 25% managed futures allocation, though the marginal benefits to risk-adjusted returns are still very strong. An optimization would still be increasing the allocation, but we limit our analysis to 25% as the high end of the range that bold advisors might be comfortable with, although we suspect that the practical limit for the vast majority is lower than 25%.
[2] We should note that this year the value in reducing losses is somewhat greater than in prior crises since stocks and bonds have declined simultaneously, whereas in prior downturns bonds have cushioned the losses from stocks. Although this relative level of protection may not be the norm, we think it still reinforces one of the more attractive features of managed futures: the flexibility of the strategy offers the potential to protect against a variety of dislocations (including ones considered unlikely, or more importantly, ones that are not even contemplated at all).
[3] We used the optimization tool at PortfolioVisualizer.com to look at Sharpe Ratio optimization for two-asset portfolios of VBIAX (Vanguard Balanced Index Fund) and a managed futures mutual fund (either AQMIX (AQR Managed Futures Strategy Fund) or ASFYX (AlphaSimplex Managed Futures Strategy Fund), two of the oldest managed futures mutual funds, both dating back to 2010. Even starting at the beginning of the decade where 60/40 dominated, an optimization through September 30, 2022 produced a portfolio of 65% VBAIX and 35% managed futures, regardless of which fund was chosen, despite their differing total long-term returns.
A CME Group study cited by RCM Alternatives (https://www.rcmalternatives.com/2016/04/the-optimal-allocation-to-managed-futures) found the optimal allocation to managed futures for the 20 years ending February 2008 (right before the worst of the GFC) to be 20%. RCM did the same exercise for the period of January 1994 through December 2015 and found the updated optimal allocation to be 35%, though ending the study any year end 2008 through 2012 would have resulted in a 40% managed futures allocation.
[4] This is highly endpoint sensitive, as managed futures outperformed the 60/40 portfolio significantly for the decade of the 2000’s, the reverse was true in the 2010’s, and the advantage has shifted back to managed futures thus far in the 2020’s. An optimization exercise run strictly during one decade versus another (much less one year versus another) could show either dramatically more benefits from including managed futures or essentially no benefit. We think this long-term view that includes strong and weak periods for the strategy is a fair way to look at the question, and we’d note that timing an allocation is not a realistic strategy.
[5] If your goal is purely maximizing returns and you have a long enough time horizon (or you feel lucky) then you should allocate 100% to equities, or to be slightly more conservative, to a balanced portfolio (equity risk dominates balanced portfolios). But you should be prepared for episodes of extreme volatility and sizeable drawdowns along the way, and hope your entry and exit points are fortuitous.
Related research

AdvisorIntelligence Q4 2022 Client PowerPoint Presentation Now Available
The latest AdvisorIntelligence Client PowerPoint presentation is now available.

iMGP High Income Alternatives Fund Due Diligence Report
The introduction of the iMGP High Income Alternatives Fund in late 2018 was motivated by several f ...
Managed Futures: DBi’s Guide For Advisors
This is a short form guide to investing in managed futures for you: financial advisors in the weal ...