Third Quarter 2023 Investment Commentary
Third Quarter 2023 Market Recap
After a strong first half to 2023, global equity markets declined in the third quarter. The S&P 500 Index reached a 2023 high at the end of July, but from its intra-quarter high the index declined 6.3% through the end of September. This was the second meaningful decline this year; the S&P 500 fell 7.5% in February and March during the regional banking failures. Despite the decline, the index is still up 13.1% year to date.
Small-cap stocks (Russell 2000 Index) also had momentum early in the quarter but changed course and ended the quarter down 5.1%. Year-to-date, small-cap stocks are still up 2.5%, but meaningfully trail large-caps. On a style basis, growth stocks lagged value stocks during the quarter.
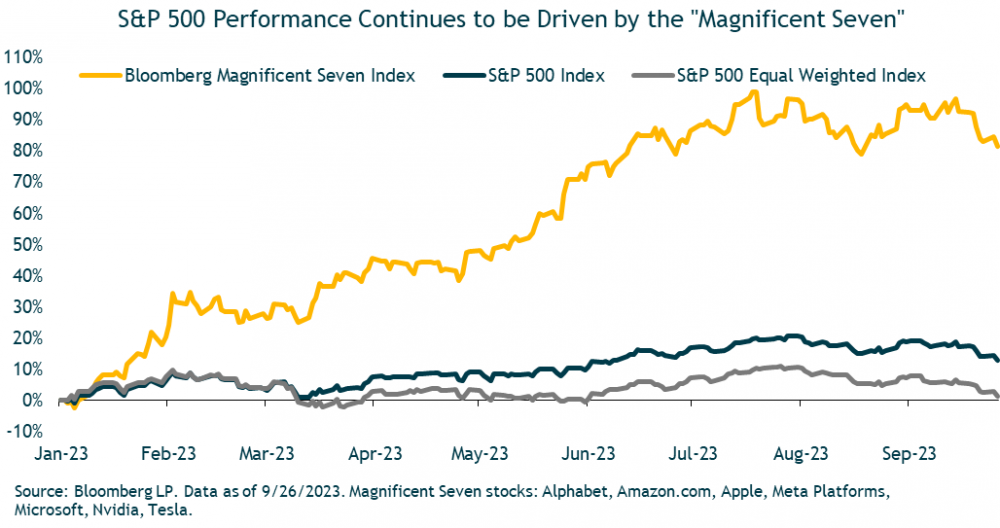
With virtually all segments of the stock market posting gains this year through September, one might think that we’re in the midst of a broad-based rally. However, stock gains have remained unusually narrow, with the largest stocks in the index leading the way. The standout performers are those sectors with the largest stocks, while most other sectors have been relatively flat. Consumer discretionary has been driven higher by a 51% gain from Amazon.com and a 103% return from Tesla. The information technology sector has outperformed thanks to Apple (32%), Microsoft (33%) and NVIDIA (198%). Communication services has been propelled higher by a 48% return for Alphabet and 149% from Meta Platforms. These seven stocks make up the “Magnificent Seven” that account for the majority of year-to-date returns of the S&P 500. Further illustrating the market-cap effect, the equal-weighted S&P 500 index is roughly flat this year through September.
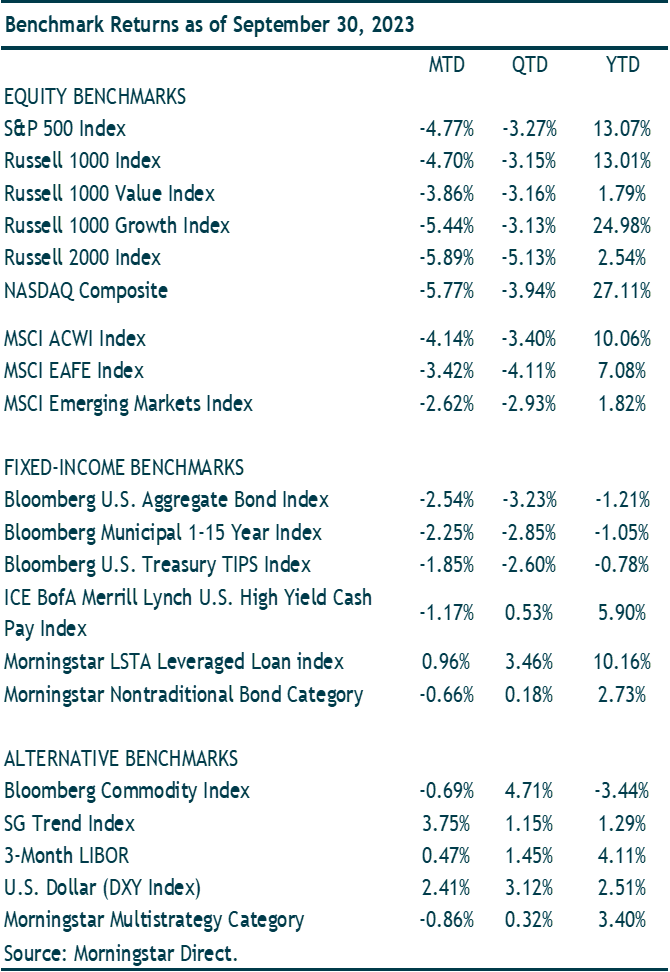
Within foreign markets, developed international stocks (MSCI EAFE) declined 4.1% in the quarter, and are up roughly 7.1% year-to-date. Emerging-markets stocks (MSCI EM) fell 2.9% in the quarter and are up 1.8% this year through September. The U.S. dollar (DXY Index) surged over 3% during the quarter, resulting in a headwind for foreign markets. Both developed international and emerging-markets stocks outperformed the S&P 500 in local currency terms but underperformed after converting returns to U.S. dollars.
Moving to the fixed-income market, core bonds (Bloomberg U.S. Aggregate Bond Index) fell 3.2% in the quarter as interest-rate rose. The benchmark 10-year Treasury yield climbed nearly 70bps in the quarter, ending the period with a 4.59% yield, the highest level since 2007. High-yield bonds (ICE BofA US High Yield) managed to eke out a small quarterly gain and are up 6% for the year-to-date period.
Finally, multi-alternative strategies (Morningstar Multistrategy Category) and managed futures (SG Trend Index) demonstrated their diversification benefits. Multi-alternative strategies returned 0.3% and managed futures gained 1.2% in the quarter.
Portfolio Performance and Key Performance Drivers
Returns for models and benchmarks were negative during the quarter—as most major asset classes posted losses. Both global stocks (MSCI ACWI) and U.S. core bonds (Bloomberg US Aggregate Bond Index) lost more than 3% in value last quarter. Our more conservative models outperformed their benchmarks, while models with higher equity exposure underperformed.
Our overall fixed-income allocation added value during the quarter. Our fixed-income allocation benefited from positions in flexible, actively managed bond funds, which collectively posted modest gains in the quarter. These funds generally benefited from being less interest-rate sensitive and owning higher yielding securities compared to core bonds. Active core bond positions were negative in the period but finished the quarter ahead of the Bloomberg U.S. Aggregate Bond Index.
The active equity managers we use, in aggregate, underperformed their indexes during the quarter. Value stocks outperformed growth stocks—resulting in most of our growth managers underperforming broader benchmarks. Our tactical overweight to emerging-market stocks was a benefit to model returns, as they outperformed U.S. stocks by a small amount during the quarter.
For the year-to-date period, our portfolios remain ahead of their benchmarks. Through the first three quarters, our active managers (both stocks and bonds) have added value. Our active fixed-income bond funds have had the biggest positive impact—as most funds have been able to outpace the Bloomberg U.S. Aggregate Bond Index’s year-to-date loss. Active U.S. large-cap funds have, in aggregate, outperformed the S&P 500 thanks to strong gains from growth managers (all up 20% to 30% compared to a 13.1% return for the S&P 500). Our active U.S. small-cap and emerging-market funds have also outgained their respective indexes so far this year—each boosting relative returns for our portfolios.
Macro Outlook for the Next 6-12 Months
As was the case last quarter, the big questions remain whether we will have a soft landing or a hard landing, and the timing. It goes without saying that the answer will likely lead to meaningfully different market outcomes. If the Fed can manage to guide the economy to a soft landing, we would expect to see the market’s gains broaden out beyond the large-cap technology-related sectors. Conversely, a hard landing would lead to broader-based declines.
There are reasons to be cautious. We have seen one of the quickest and sharpest tightening cycles in history, and lending standards have tightened considerably. Both factors create recessionary conditions, particularly as the Fed has a history of raising rates too far, tipping the economy into recession. Since 1931, there have been 19 hiking cycles and in only three instances did the economy avoid a recession.
We have already seen some negative impact of rapidly rising rates. Earlier this year, higher rates played a key role in the regional bank failures, which led to a drying up of liquidity in the real estate sector, pushing property values sharply lower. We have also seen corporate earnings decline, and as a result there has been an increase in bankruptcies particularly among non-public, loan-only issuers (as opposed to issuers of both loans and bonds) that were already struggling. On the consumer front, there is some evidence that low-income consumers are facing stress, while middle-income consumers are becoming increasingly reliant on credit card debt.
With tighter money and credit conditions, it’s likely that the impact of higher rates is just beginning, and we expect it will be a drag on consumers and corporations. Higher rates should result in less spending, which eats into consumption. It’s also possible, if not likely, that bank lending will remain constrained in the near- to intermediate- term, further constraining growth.
With the Fed in inflation-fighting mode, and interest rates high, our base case is that there will be a recession, particularly if rates nudge even higher and remain elevated. There are many market indicators that support the recession outlook. The Treasury yield curve has been and remains steeply inverted, and this has historically been a good (but not bulletproof) predictor of recession. The Conference Board’s Leading Economic Index (LEI) fell again in August. The LEI index has now declined for nearly a year and a half straight, indicating the economy is heading into a challenging growth period and possible recession over the next year. Meanwhile, there is some clear evidence that the tighter monetary policy is impacting the housing market and lending conditions, which impacts business investment.
For the Fed to cut rates, it’s likely they’ll want to see cracks on the labor front. We are seeing some early signs of slack, but overall, conditions remain relatively tight. This labor backdrop is generally good for consumption, which makes up roughly two-thirds of U.S. GDP, and if this persists, it could extend the current cycle. Strong employment is typically correlated with wage growth, and high wages generally add to inflationary pressures. It’s quite possible that until employment metrics erode, we could see rates remain at or near current levels.
While we anticipate a recession, our base case is that it will be relatively mild. One consideration is that the economy has been experiencing a “rolling recession,” where slowdowns are spread across industries over time, dampening the impact compared to a recession when industries experience a simultaneous slowdown. For example, housing has already experienced a slowdown and detracted from GDP for several consecutive quarters. Some market observers refer to a “richession,” where job cuts have occurred in higher-paying industries like technology, where employees generally have a financial cushion to withstand a period of unemployment and therefore are better positioned to sustain spending and helps support the economy.
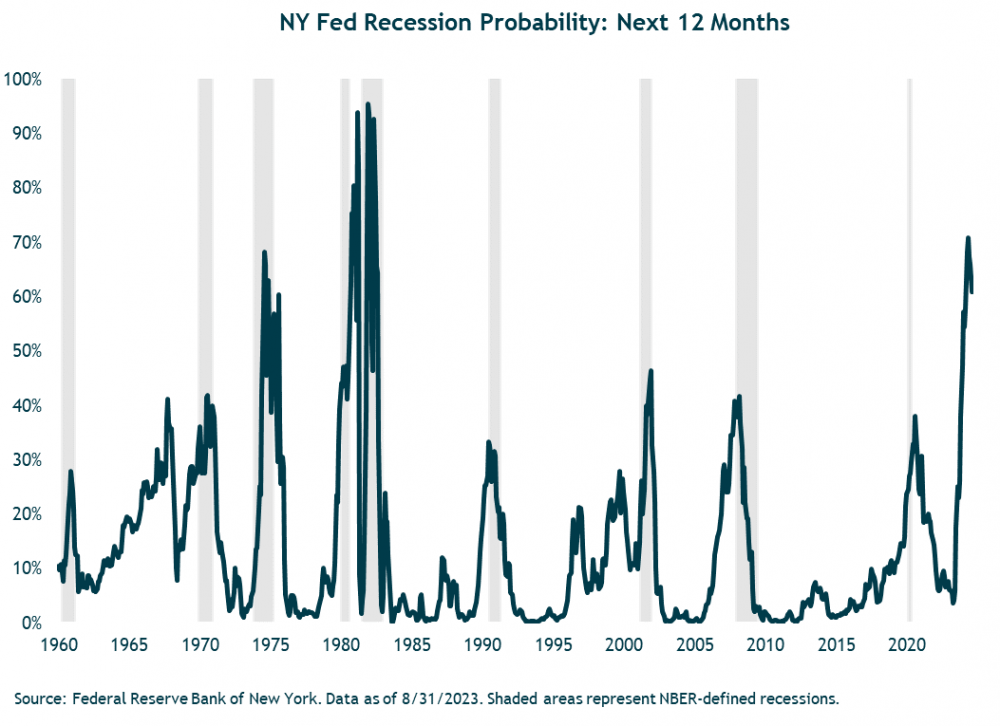
A perhaps counterintuitive point is that because this recession has been so widely anticipated for so long now, it may actually reduce the risk of a deep recession. According to New York Federal Reserve data there has been a 60% chance of recession occurring in the next twelve months. (See chart below.) Historically, probabilities at these levels are associated with recessions. And going back to late 2022 and early 2023, the press termed this the “most-anticipated recession ever.” Amid all this built-up anticipation, some companies, especially tech have laid off workers and slowed hiring. These corporate moves help to loosen the labor market and potentially ease inflation pressures.
What about Inflation?
Inflation has come down meaningfully from its June 2022 high of 9.1%, thanks in part to the Federal Reserve’s rapid rate hikes. At this point, it is clear the rate-hike regime is close to an end. In late September, the Federal Reserve maintained the target range for the federal funds rate at a 22-year high of 5.25%-5.5%, following a 25bps hike in July. The September pause was in line with market expectations. But Fed Chair Powell signaled there could be another hike this year saying that the FOMC cannot allow inflation to get entrenched in the U.S. economy, and they will do what it takes to get it down to their target of 2% over time. The most recent year-over-year inflation number was 3.7%, almost twice the Fed’s long-term target. Projections released in the Fed’s dot plot showed the likelihood of one more 25bps increase at the November 1 meeting, then two cuts in 2024.
While the Fed continues to be concerned about inflation, there are signs that the effects of Fed policy are working their way through the system. We believe that the Fed has gotten the upper hand on inflation and that the remarkable impact that the pandemic had on prices due to supply shortages and the dramatic shift consumer behavior is clearly over.
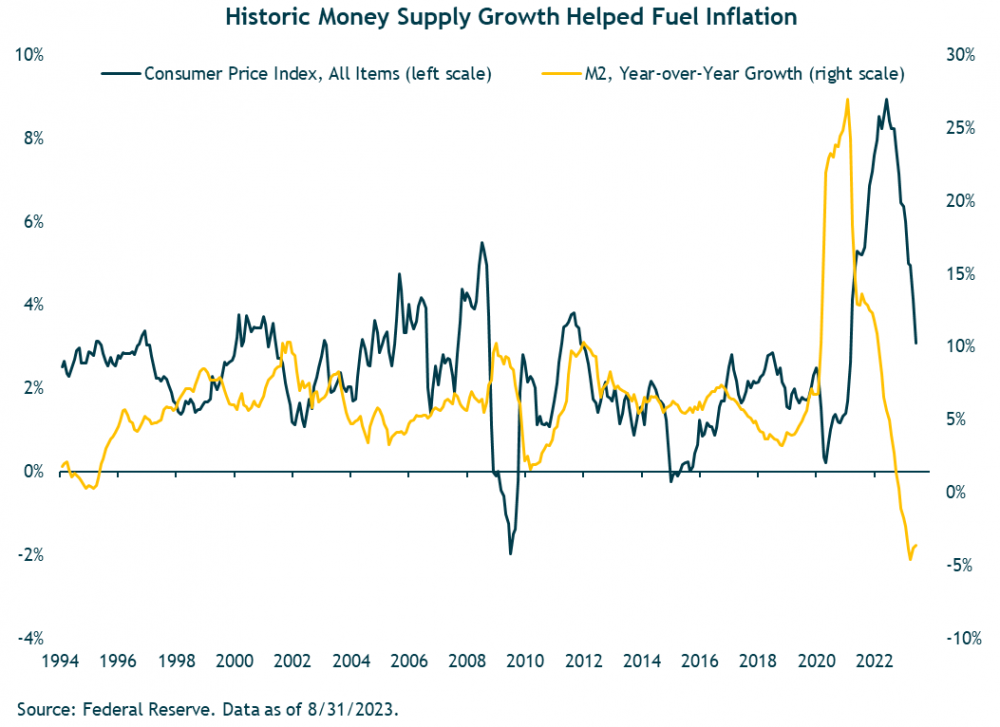
While there are a variety of opinions around inflation, it seems clear that one driver was the massive amount of money supply growth that started in early 2020. Pandemic-related stimulus payments were in the trillions. The chart below shows the dramatic increase in Money Supply (or M2) that occurred. Arguably, the supply chain issues and the flood of money that went into the economy is what pushed inflation to unexpected levels. If we compare the year-over-year money growth to year-over-year core CPI, one could surmise that inflation is a lagging indicator and inflation could continue decline from current levels.
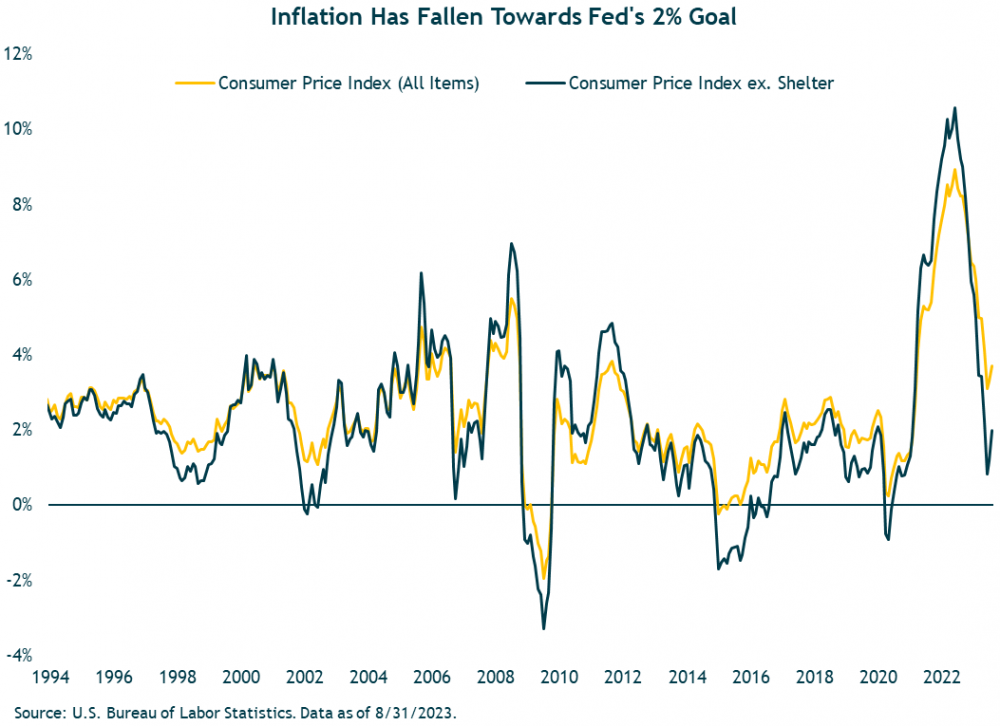
The chart below illustrates the year-over-year inflation and year-over-year inflation excluding shelter costs, which is a key CPI input. While year-over-year inflation recently came in at 3.7%, this number drops to 1.97% when excluding shelter. We also look at more recent trends by annualizing the latest six months of inflation data, to get a sense for shorter-term trends. Annualizing the latest six months, inflation is 3.0% and inflation ex-shelter is 1.8%. These levels are not far from the Fed’s goals, and suggest that the Fed’s policy has been working, and with time inflation could continue to fall, particularly if shelter continues to decline.
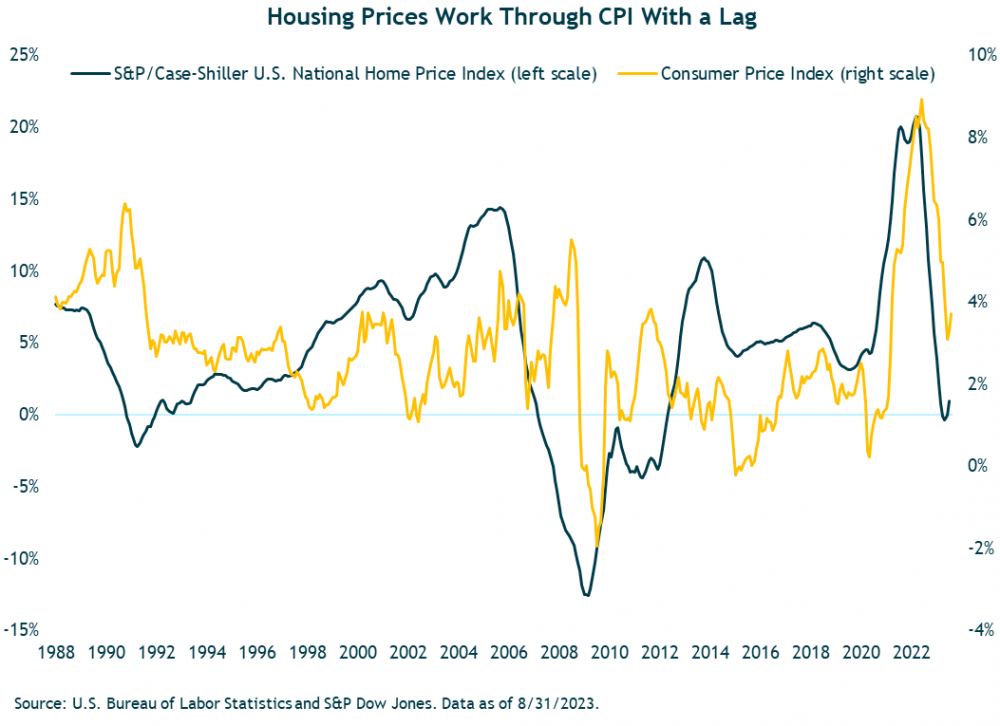
Looking at shelter, below is a chart showing that year-over-year housing prices have historically led inflation, with a lag. Housing makes up a 34% weight of CPI, so if this relationship holds, it suggests that inflation will continue to decline in subsequent months.
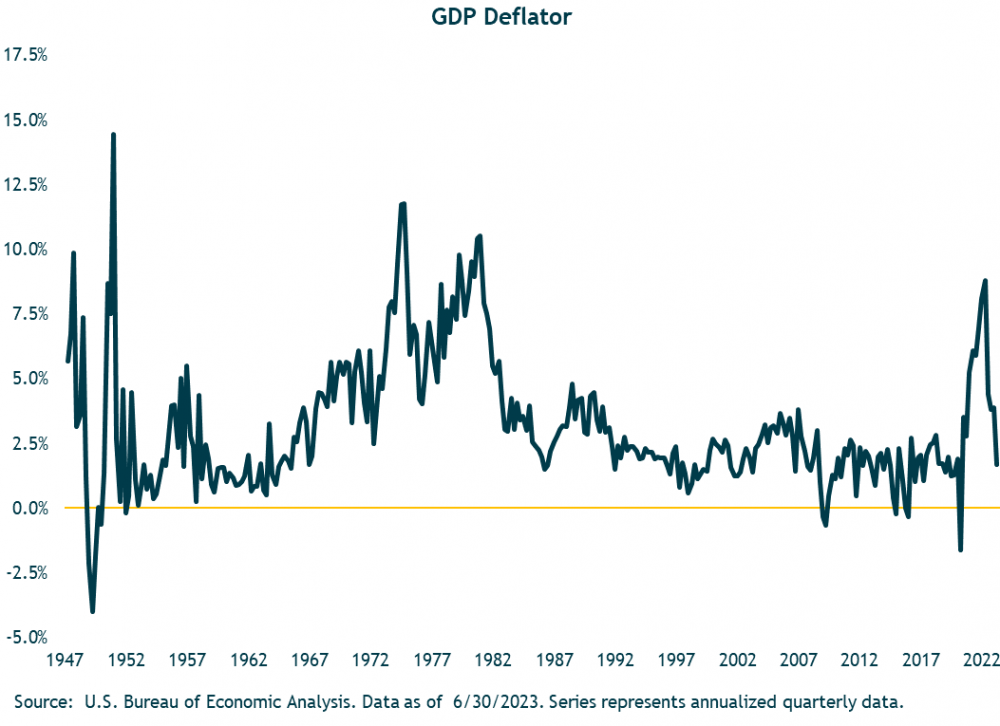
Another metric is the GDP Deflator, which is a broad measure of the changes in prices for all goods and services produced in an economy. By comparison, CPI is based on a fixed basket of goods. (Both measures have their pros and cons.) The chart below illustrates the quarterly annualized rate of inflation according to the GDP deflator, and the most recent reading was 1.7%.
While we expect inflation to grind lower over the course of 2024, we don’t expect inflation to return to the persistently low levels we saw pre-pandemic. Internally, we have been talking about the effects that the pandemic has had on economic data, and why some of the traditional economic indicators are proving less reliable than prior cycles. For example, there’s the level of volatility we’ve seen within the services component of inflation, which is usually relatively stable, but was unprecedentedly volatile during and after the pandemic. We saw a dramatic drop in services during the lockdowns and then a record spike. The point being that in the near-term, we think it’s likely there will be some near-term seasonal impacts, resulting in some pockets of higher inflation, but not to concerning levels.
Although we expect near-term inflation to remain under control, longer-term we expect there will be upward pressure on inflation, and it will be more of a moving target. One factor we must consider shifting geopolitics. The global economy is undergoing a transformation with the shifts to supply chain resilience, clean energy transition, artificial intelligence, among others. Christine Lagarde, President of the ECB in an April 2023 speech said, “We are witnessing a fragmentation of the global economy into competing blocs, with each bloc trying to pull as much of the rest of the world closer to its respective strategic interests...” and that this fragmentation could have two profound effects: More instability as global supply chain elasticity wanes and the potential for more geopolitical tensions. She also cites an analysis suggesting that if the global value chains fragment along geopolitical lines, “the increase in the global level of consumer prices could range between around 5% in the short run and roughly 1% in the long run.”
Financial Markets Outlook for 2023 and Beyond
Equity Markets
The aggressive hiking cycle that started roughly 18 months ago was finally put on pause in late-July—although one more 25 basis point hike could still happen. Since March 2022, the Federal Reserve increased rates from zero to a target level of 5.25%-5.5%. Around the same time that the Fed hiked for what might be the final time in this cycle, the S&P 500 also hit an intra-year high and started to decline. Since the end of July, the S&P 500 has fallen 6.3%. The Index remains up a solid 13.1% so far this year—defying many expectations in what was widely anticipated to be a year in which the economy hit the skids.
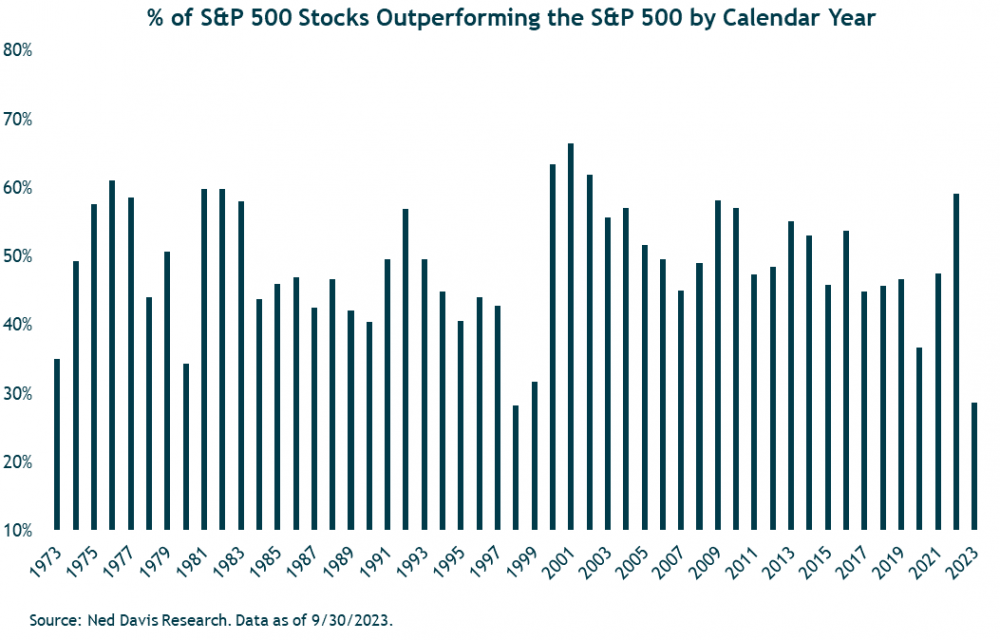
As noted earlier, despite stalling over the third quarter, the year-to-date outperformance of the seven largest stocks in the S&P 500 continues to explain most of the U.S. equity returns. These seven mega cap companies make up close to 30% of the index and have a combined value of $10.7 trillion! These “magnificent seven” have increased more than 80% this year. The other 493 stocks are basically flat. Given those figures, it is unsurprising to see a record low percentage of S&P 500 stocks outperforming the index. Ned Davis Research data shows just 28% of S&P 500 constituents have a return better than the 13.1% index return this year.
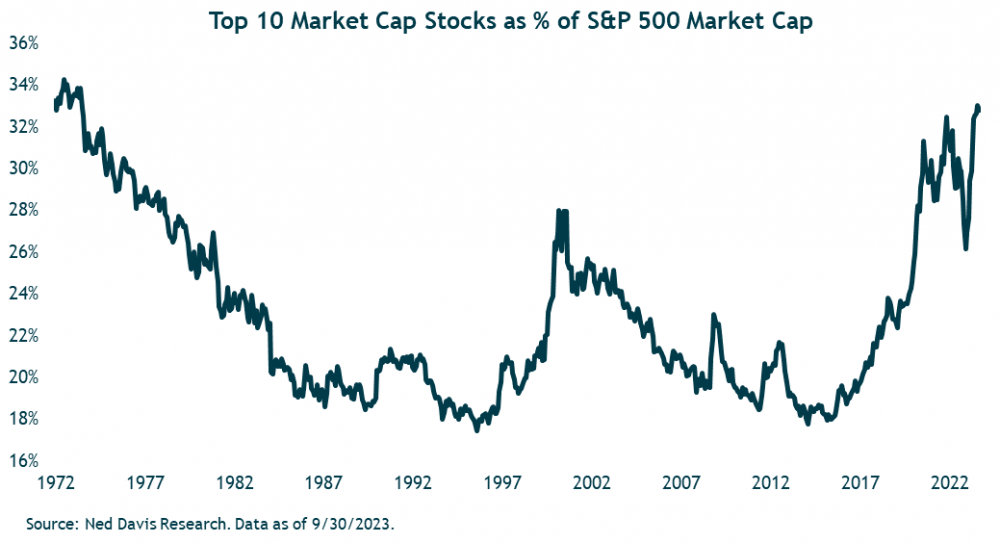
The concentration within the S&P 500 has soared past where it was in 2021 and the tech bubble. It is closing in on a level last seen during the early-1970s—a period known for the leadership of the Nifty Fifty stocks. The chart below shows the top 10 stocks accounting for one-third the total market capitalization of the S&P 500.
Profits Troughing?
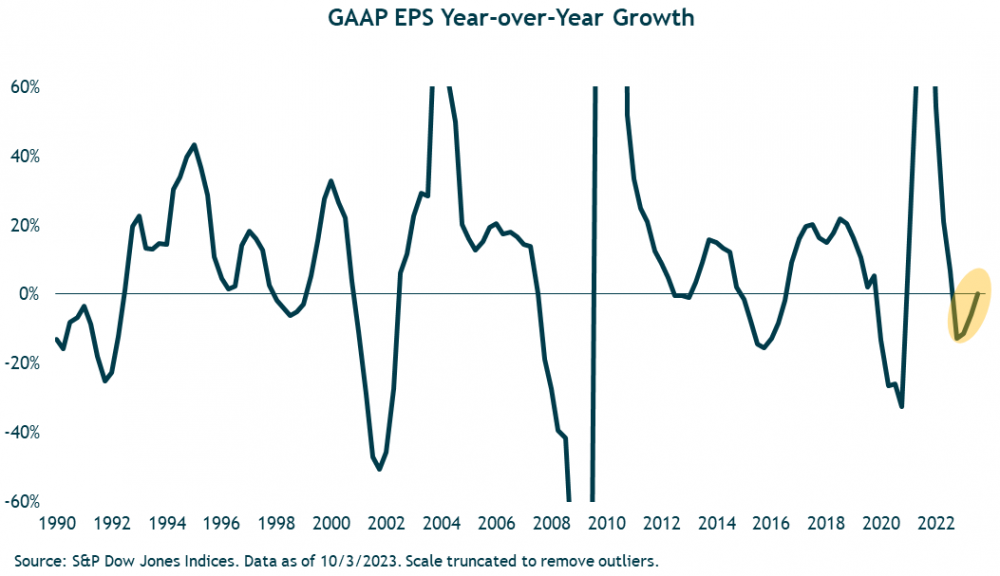
Last year S&P 500 profits (GAAP) fell by nearly 13%. The consensus going into 2023 was for a recession and that profits would likely fall further in that scenario. With the recession having been avoided (for now), profits are showing signs of troughing. Should the current consensus numbers for the third quarter be accurate, earnings will be flat year-over-year. And the fourth quarter has the potential for year-over-year growth in the double-digit range.
Better than expected profit growth in recent quarters has been bolstered by strong revenue growth. S&P 500 sales (which are nominal) are growing at a double-digit pace thanks to a stronger than expected consumer and price increases that are still being pushed through. Profit margins have fallen back to 10%, which was where they stood prior in 2019. But despite lower margins, companies can continue to decent earnings growth if revenues remain robust. Not until there is a recession will revenues and GDP take a hit.
If The Fed Has Paused, What’s Next for Stocks?
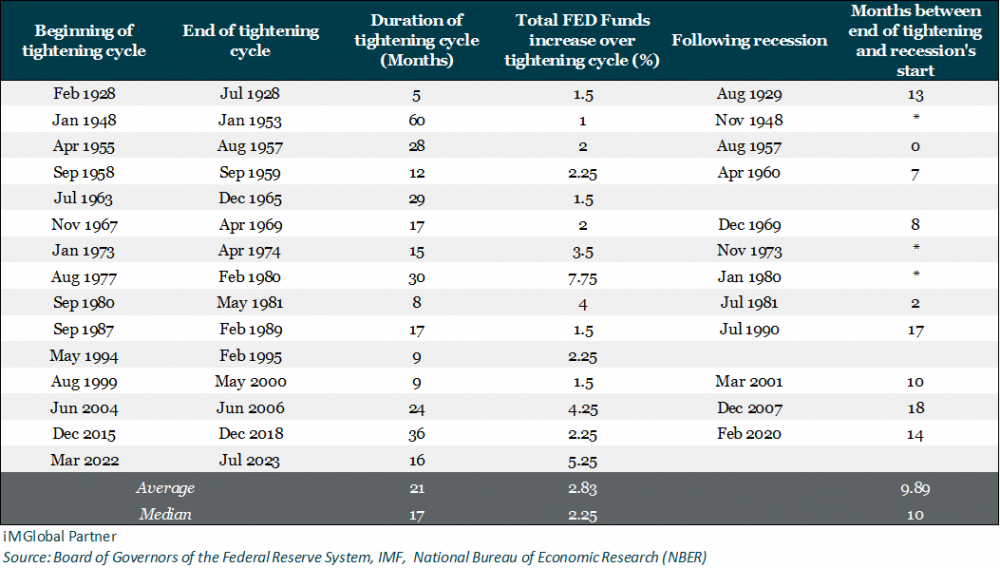
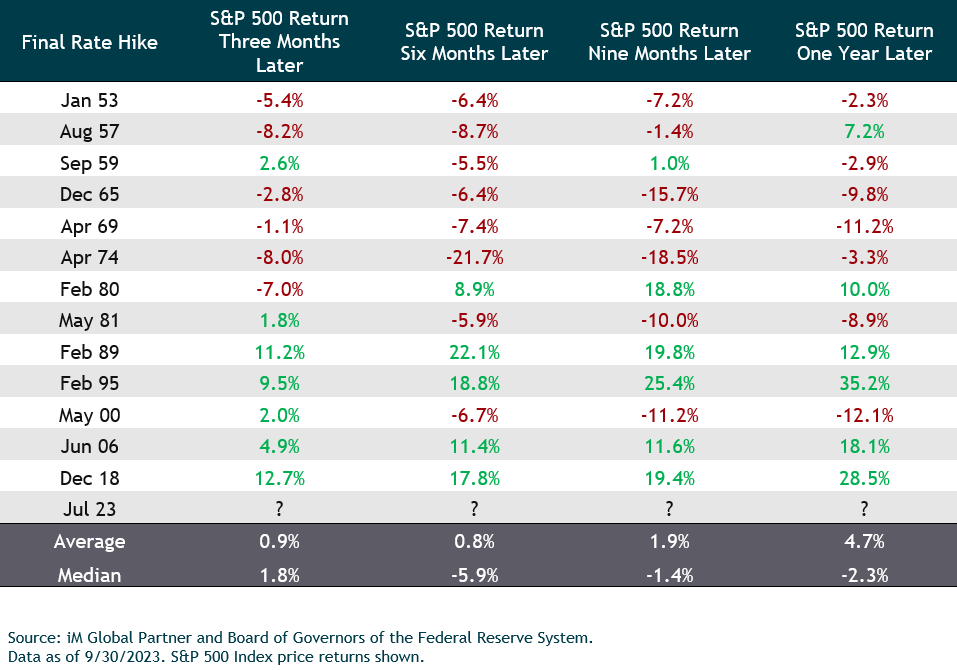
Historically, the track record for what happens for stocks over the next six to 12 months following a pause in a tightening cycle is mixed. The table below shows the tightening cycles over the last 70 years. On average, the market has been flat over the subsequent six months and up mid-single digits over the next year. However, to be fair, “on average” does not happen in markets and there is a variation of outcomes depending on a multitude of factors. Even a short six-month time frame shows returns ranging from negative 20% to positive 20%.
Equity returns following the end of a tightening cycle have differed depending on the inflation environment. Most of the negative outcomes in the table below occurred during bouts of elevated inflation (particularly through the 60s and 70s). Because of higher inflation, the Fed will typically maintain a more restrictive policy—i.e., it will take them longer to pivot and cut rates. On the other hand, when inflation is not historically elevated, the Fed can move to a more accommodative stance much sooner. This can be seen in the table in terms of the much shorter time between the final rate hike and the following rate cut in the post-80s period.
Today, inflation remains elevated but on a clear path downwards. However, the S&P 500’s current 7.5% drawdown that started right around the day of the (potentially) final rate hike could be a sign that equity markets are finally starting to believe the Fed’s “higher for longer” mantra.
International and Emerging-Markets Stocks
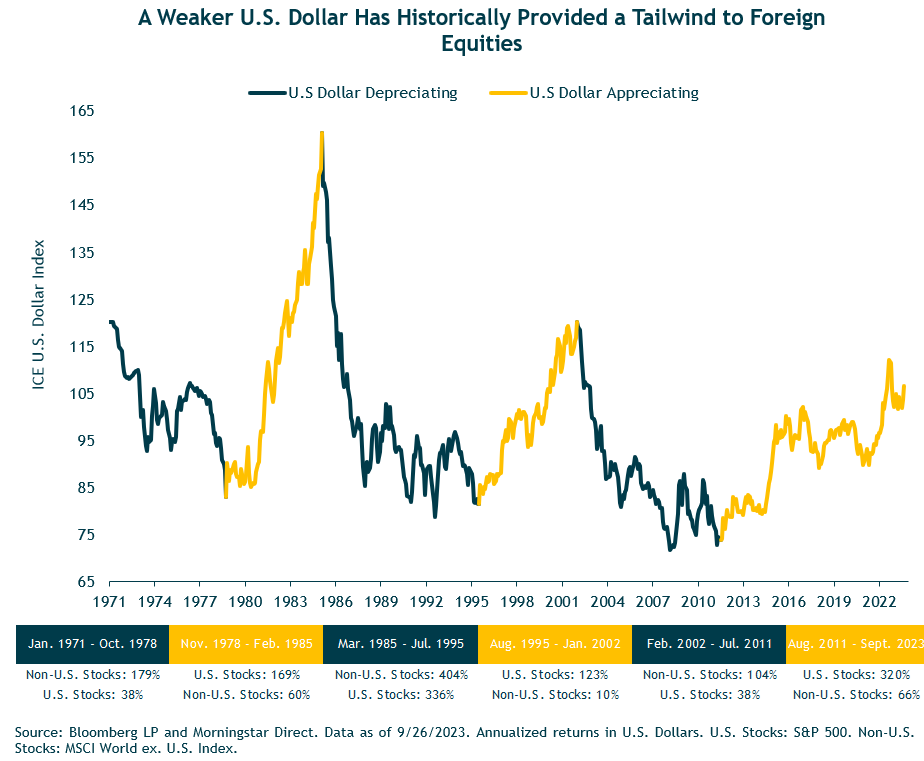
The U.S. dollar (DXY Index) appreciated 3.1% during the quarter and was a major headwind for unhedged foreign assets. The local currency indexes for MSCI EAFE and MSCI Emerging Markets both outperformed the S&P 500 with losses a little more than 1%.
The appreciating U.S. dollar has been a significant deterrent for international stocks (see chart below). In the current regime of U.S. dollar strength that started in 2011, U.S. stocks have significantly outperformed foreign stocks. There was a short reprieve from dollar strength from 2017 into early 2018 during which European stocks outperformed by nearly four percentage points and emerging-market stocks did nearly 20 percentage points better. When the dollar declines again, we would expect foreign equities to outperform—much like in other cycles over the past 50 years.
While U.S. earnings are potentially troughing—or, at a minimum, the rate of decline slowing—earnings overseas are at different points. Earnings in Europe remain close to cycle highs despite a stagnant German economy. Emerging markets, on the other hand, have seen their earnings fall roughly 17% from their high in early 2022. China has struggled to meaningfully reignite its economy, and consequently, earnings have not moved much higher from their cycle lows. Given China’s weight in the broader index (roughly 30% of MSCI EM), their sluggish earnings continue to weigh on index level earnings.
The Chinese stock market (MSCI China) has bounced higher from its lows almost one year ago. However, Chinese stocks remain more than 50% lower than where they stood in early 2021. Since 2021, China has experienced a number of rolling crisis’s—from their property bubble to regulatory crackdowns on for-profit education and technology companies to a zero-COVID policy that lasted into late 2022. The government has resisted their old stimulus playbook of showering money into capital intensive investments. Instead, Chinese officials have used targeted easing policies, such as lowering key interest rates. As China moves away from investment-led economic growth, there will be a high bar for the government to undertake the same level of stimulus as in years past.
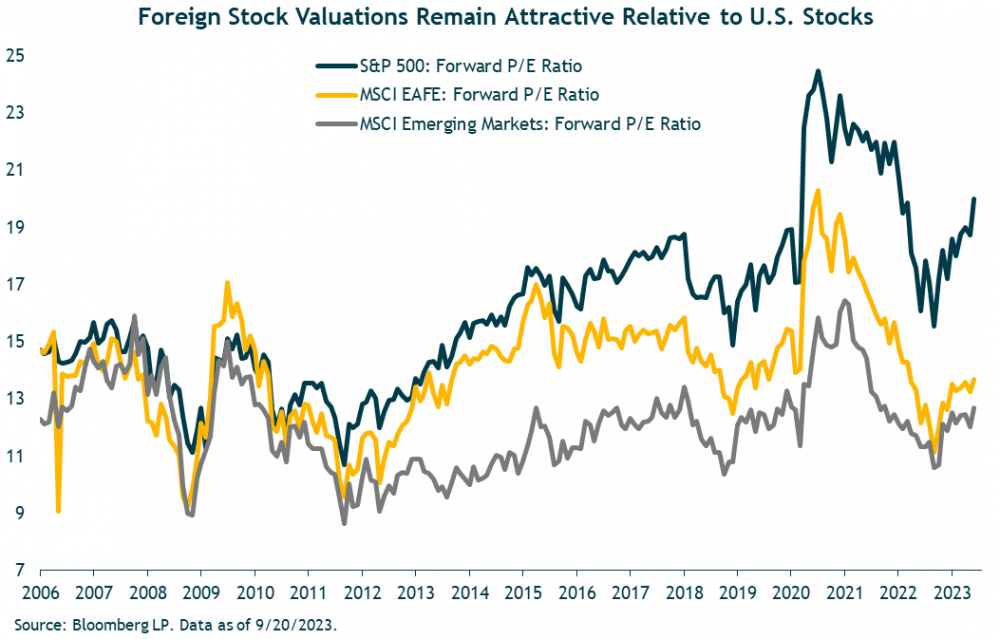
Valuations of foreign equities remain attractive relative to U.S. valuations and explain our slight overweight to emerging market equities. The S&P 500 trades at roughly a 19x forward P/E compared to just over 12x for emerging markets and 13.5x for European stocks. U.S. stocks are trading at their largest premium in the current cycle of outperformance by U.S. stocks.
Fixed-Income
Inflation and Fed policy will continue to be major drivers of bond market returns. Our expectation is that the yield curve will continue to flatten and perhaps even steepen out over the course of 2024, particularly if signs of economic weakness prompts the Fed to lower short-term rates. But for now, investors continue to benefit from today’s higher yields and an inverted yield curve. Despite higher short terms rates, we continue to maintain some exposure to the longer-end of the curve with core bonds. The Bloomberg U.S. Aggregate Bond Index is currently yielding 5.4%, which is above the current 3.7% inflation level. So, bonds are finally providing a positive real (after-inflation) yield. We also continue to hold core bonds as a ballast to balanced portfolios, as we believe they will likely provide some downside protection in the event of a recession.
We continue to be positive on corporate bonds. Overall, credit fundamentals are still holding up despite higher debt costs. Interest coverage, the level of leverage, and cash levels all look better than in historical periods heading into a recession. In addition to core bonds, we continue to have meaningful exposure to higher-yielding, actively managed, flexible bond funds run by experienced teams with broad opportunity sets. There are several fixed-income sectors outside of the traditional parts of the bond market that provide attractive risk-return potential, and we access them through active managers. Some of these funds are currently yielding in the high single digits, while maintaining an eye on capital preservation. In fact, some of our bond holdings have incrementally become defensive through the year.
Marketable (Liquid) Alternatives Investments
Our highest conviction alternative strategy in terms of diversifying traditional assets remains managed futures. While the (artificially) low volatility of most private asset classes is understandably comforting to investors, and they have performed well in absolute terms over time, they can’t be relied upon to provide liquidity to rebalance in the way managed futures strategies can. Managed futures stand a reasonable chance of generating positive absolute performance during periods of losses for equities and/or bonds, and in the case of standout years like 2022, sometimes huge spreads of 20, 30, or even 50 percentage points of difference, creating valuable opportunities to add to beaten down assets, in addition to the psychological benefits of having something in a portfolio that’s “working” even when almost everything else is showing losses.
Managed futures bounced back in the second quarter after a very challenging first quarter of the year. Through June, the Trend Index was up 0.1% and the CTA Index was flat. (The SG Trend Index is a subset of the SG CTA Index that includes only trend followers, while the broader index includes strategies other than trend, such as mean reversion, carry, discretionary trading, etc., although the two indexes are highly correlated.) The third quarter saw mild losses through the first two months, with the Trend Index down 1.6% and the CTA Index down 1.1% in July.
August was another challenging month as there were significant reversals in currencies and equity markets, leading to additional losses of 1.0% and 0.5% for the Trend and CTA indexes, respectively. September was a different story for managed futures, however, while proving to be a challenging month for traditional assets. During September, the Trend Index gained 3.7% and the CTA Index returned 3.6%, leaving them in positive territory for the quarter (1.2% for Trend and 2% for CTA). They are also positive by approximately the same amount this year. The strong trends of higher Treasury yields, a stronger U.S. dollar, and higher oil prices contributed to gains for the strategies, while core bonds fell by more than 3% and broad global equity indexes were down between 3% to 4%.
More broadly, the HFRI Fund of Funds Composite Index was up less than 1% through the first two months of the third quarter, leaving the index up 3.2% on the year through August. The Equity Hedge index was up 0.9%, following the same pattern as the S&P 500, up in July and down in August, though by less in both directions. Year-to-date it was up 6.6%, although it is likely to be down by a decent amount in September.
As usual, there is broad dispersion by sector/style, with technology-focused funds up significantly more than the broader index through August, but likely to fall sharply in September when performance is reported. Event-driven funds, and merger arbitrage specifically, suffered a challenging environment in the first half of the year due in part to the difficult regulatory climate. The FTC and DOJ’s explicit attempts to block some major deals created an environment of high uncertainty, leading to wider deal spreads and likely lower volume of announced deals than would otherwise have been the case.
The HFRI Merger Arbitrage Index was down almost 3% through the first half of the year, but up almost 4% in the first two months of the third quarter as fears over regulatory challenges subsided significantly, driven in part by a U.S. appeals court’s denial of the FTC’s attempt to block Microsoft’s acquisition of Activision Blizzard. Year-to-date through 9/27, public funds/ETFs in the space are up between 1% and 4% for the quarter, and between 1% and 5% for the year.
Closing Thoughts
As we look ahead, a mild recession is still our base-case looking out to 2024. Of course, the timing and magnitude of the Fed’s response to economic data will be critical to the outcome. Currently, the Fed is signaling 50 basis points of rate cuts in 2024, but it’s quite possible that they will cut more meaningfully. Therefore, we can’t rule out the possibility that the Fed does thread the economic needle and successfully guides us to the rare soft landing. Given the uncertainty, we expect volatility, and we think that it will be more critical than ever to keep our pencils sharp and be ready to take advantage of market dislocations. This is not to suggest that we are changing our stripes as long-term investors. We continue to believe that taking a disciplined long-term view is the path to successful investing. We will maintain a balance of offense and defense, seeking attractive risk-reward opportunities that are supported by thorough analysis. We thank you for your continued confidence.
We also want to acknowledge the departure of Jeremy DeGroot, our long-time friend and colleague. In June 2021, Litman Gregory became part of global asset management firm iM Global Partner (iMGP). The strong alignment in investment philosophy, expansion in research capabilities, and strengthening of investment solutions were among the key drivers in the decision. iM Global Partner’s research focus is global in nature and the expertise of the global group includes analysts in London, Paris, Luxembourg, and the U.S. Following the merger, the U.S. research team was integrated, with iMGP Global Chief Investment Officer (CIO) Philippe Uzan leading the group and Jeremy DeGroot becoming Chief Investment Officer, Asset Management U.S. and reporting to Philippe.
After 24 years with Litman Gregory/iMGP, Jeremy departed effective September 20, 2023. We are grateful to have benefited from Jeremy’s keen intellect, deep investment knowledge and discipline during his long tenure. It is never easy to say goodbye to a long-time colleague but given the strength and breadth of our team, we believe our overall asset management framework continues to be strong. Looking ahead, it is our goal to continue to enhance our research capabilities as we seek to deliver on our mission to help clients achieve their financial goals.
Note: For discretionary use by investment professionals. This document is provided by iM Global Partner Fund Management, LLC (“iMGPFM”) for informational purposes only and no statement is to be construed as a solicitation or offer to buy or sell a security, or the rendering of personalized investment advice. There is no agreement or understanding that iMGPFM will provide individual advice to any investor or advisory client in receipt of this document. Certain information constitutes “forward-looking statements” and due to various risks and uncertainties actual events or results may differ from those projected. Some information contained in this report may be derived from sources that we believe to be reliable; however, we do not guarantee the accuracy or timeliness of such information. Past performance may not be indicative of future results and there can be no assurance the views and opinions expressed herein will come to pass. Investing involves risk, including the potential loss of principal. Any reference to a market index is included for illustrative purposes only, as an index is not a security in which an investment can be made. Indexes are unmanaged vehicles that do not account for the deduction of fees and expenses generally associated with investable products. Returns shown for individual securities holdings are calculated on a gross and unrealized basis and do not account for the deduction of iMGPFM’s management fees, which would adversely impact net results. A list of all recommendations made by iMGPFM within the immediately preceding one year is available upon request at no charge. For additional information about iMGPFM, please consult the Firm’s Form ADV disclosure documents, the most recent versions of which are available on the SEC’s Investment Adviser Public Disclosure website (adviserinfo.sec.gov) and may otherwise be made available upon written request.
Related research

Asset Class Update: US Stocks
We believe US stocks can generate mid-single-digit returns in a base case. However, heightened sho ...

AdvisorIntelligence Q4 2022 Client PowerPoint Presentation Now Available
The latest AdvisorIntelligence Client PowerPoint presentation is now available.

iMGP Alternative Strategies Due Diligence Report
The iMGP Alternative Strategies fund is a multi-manager, multi-strategy fund that combines alterna ...