January 2022 Monthly Market Update
The Month At-A-Glance
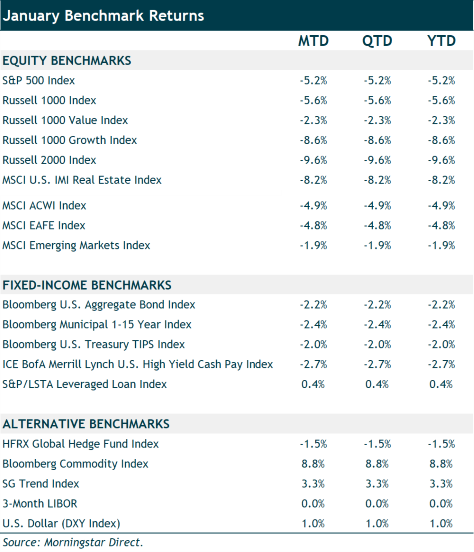
- Volatility picked up in January resulting in negative returns for both equities and fixed income.
- Fed Chair Jerome Powell has become increasingly hawkish over the last two months as inflation has continued to run at 40-year highs.
- With a rate lift-off all but guaranteed in March, investors are grappling with how quickly the Fed might raise rates in the coming quarters, as well as when it will begin its balance sheet run off (quantitative tightening).
- The highly transmissible Omicron variant sent COVID-19 cases soaring to a record high—however, investors largely looked through this and instead fretted about the rate environment.
Market Recap
U.S. equity markets started off the year in the red. The S&P 500 lost 5.2%, while the Russell 2000 Index fell 9.6% in January. Both were the worst start to a year since 2009. Markets jumped higher over the last few trading days of the month; however, it was not nearly enough to pull markets into positive territory. At one point in the January, the S&P 500 was down almost 10% from its recent all-time high. Small-caps and technology stocks have fared worse in the recent bout of volatility—with the Russell 2000 and NASDAQ Composite falling 20.7% and 16.8%, respectively, since their highs last November. The hardest hit segment of the market has been small-cap growth stocks, which have fallen nearly 30% since last February.
International equity markets fared better than domestic markets despite the U.S. dollar strengthening nearly 1% in January. Developed international stocks fell 4.8% and emerging-markets stocks lost 1.9% last month. We highlighted U.S. dollar strength as typically being a headwind for foreign stock returns in our year-end commentary. While this has certainly been the case over the past year, foreign stocks bucked this trend in January and outpaced U.S. markets despite the stronger dollar.
The bond market also started the year off on rocky footing. Investors pushed rates higher as the Fed continued to signal the end of easy money policies and rate hikes in coming months. Rates moved sharply higher on the short-end of the Treasury curve—rising approximately 40 basis points in the one-to-five-year part of the curve. The heavily watched 10-year Treasury yield went from 1.52% to 1.79% during January. As a result, the core bond index fell 2.2% in January—its worst start to a year since 1980. High-yield bonds fared slightly worse with a loss of 2.7%. Floating-rate loans outperformed with a modest gain of 0.4%.
Notable Events
The wheels are in motion for the Fed to begin tightening monetary policy at their next policy meeting, and investors are watching nervously. The Fed has pivoted relatively sharply in recent months—moving from being patient on inflation to a stance that’s much more aggressive. The current plan is to stop asset purchases by early March, raise the Fed funds rate in mid-March, and start quantitative tightening (reducing their balance sheet) soon after.
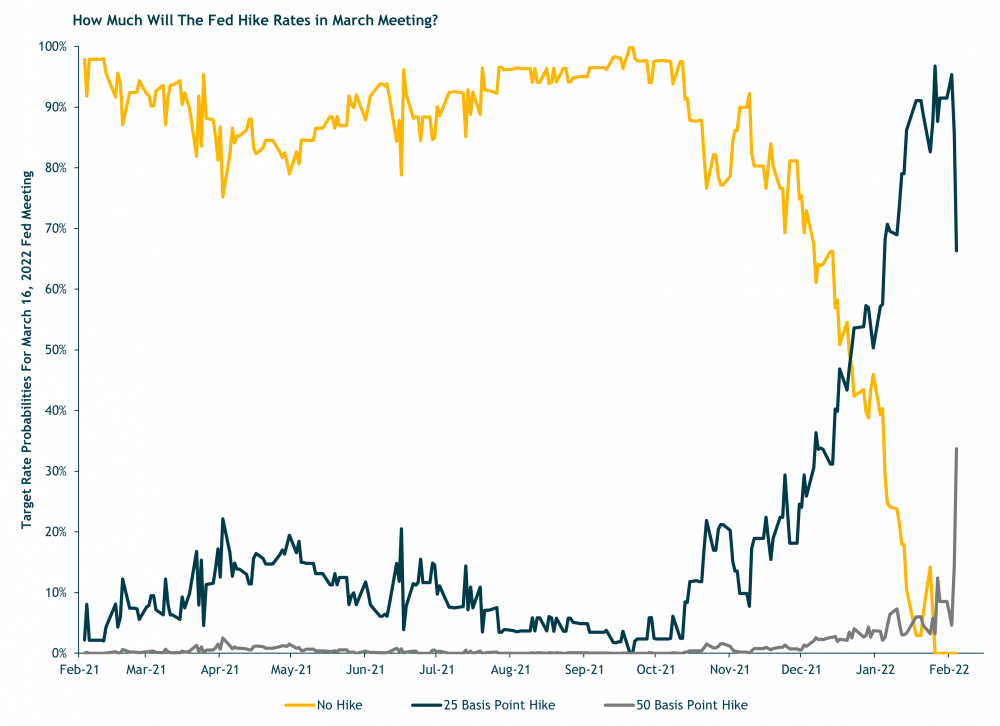
With headline inflation running at a 40-year high and the labor market on solid footing (recall the Fed’s mandate of stable prices and maximum employment), it is hard to argue that the current easy monetary policy is warranted. The bond market no longer thinks so—and has been increasingly betting on numerous rate hikes this year. As shown in the chart above, since last November, the market has been upping the odds that the Fed would increase rates at their March policy meeting. By January, it reached near certainty that the Fed would hike. And it is interesting to note that in recent days there has been a significant jump in the probability of the Fed raising rates by 50 basis points. Though it’s not the likely outcome at this point, the market has ascribed as high as a 33% chance of a 50 basis point hike in March. It wasn’t long ago that the Fed was signaling to the market that they didn’t expect to raise the Fed Funds rate until 2024. However, the inflation data has continued to come in well above target and the labor market has tightened with wages rising—leading to the Fed pivoting sharply.
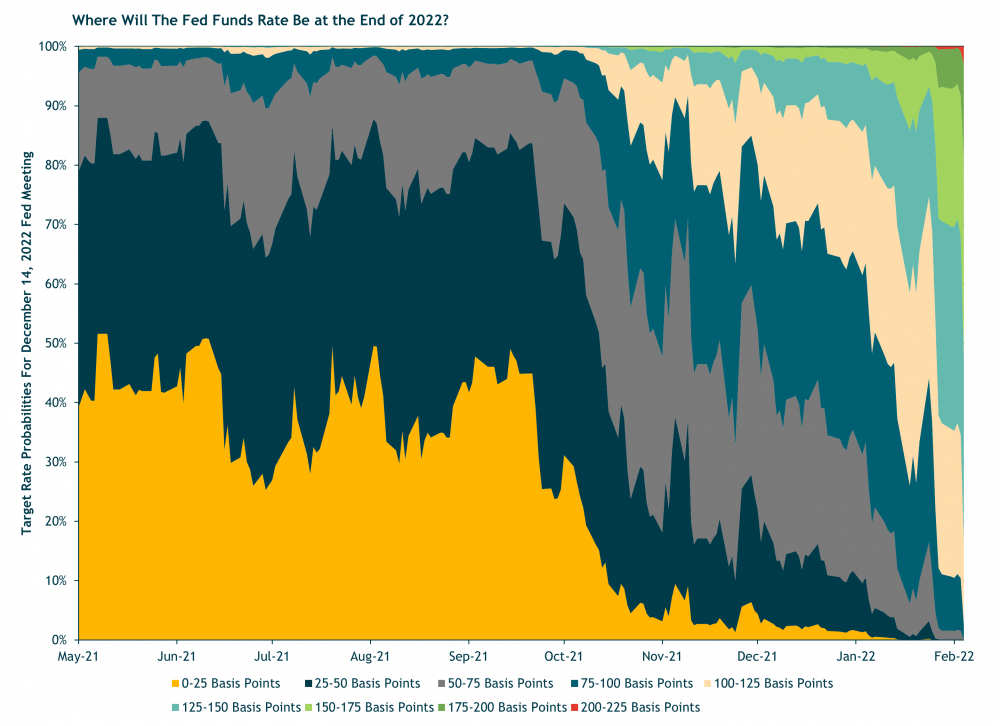
With lift-off all but certain for March, investors are betting on multiple rate hikes in 2022. Current data shows the market giving the highest probability to a Fed Funds rate at 1.25%-1.5% in December. This equates to five hikes in 25 basis point increments. This would be a significantly faster pace than the last hiking cycle (2015 to 2018). It took two years—December 2015 to December 2017—for the Fed Funds rate to get to 1.25%-1.5%. The market is wagering that the Fed may get there in just nine months this time around. Of course, inflation is the key variable that is vastly different today than it was seven years ago (both core PCE—the Fed’s preferred inflation measure—and headline CPI averaged sub-2% back then). With core PCE at nearly 5% and CPI over 7% today, a faster hiking cadence appears to be in the cards. But as always, the Fed says it will remain “data dependent,” and there is no guarantee the current market (or Fed) rate expectations will play out.
Investment Takeaways
In a period of rising interest rates, we would expect our active bond managers, in aggregate, to outperform the Bloomberg U.S. Aggregate Bond Index. And we would expect our tactical position in floating-rate loans funds to also add value. During the last hiking cycle (first hike in late-2015 to last hike in late-2018), the core bond index returned just shy of 2% annualized. While returns were positive for core bonds, it is worth noting that the yield environment was different back then from what it is today. Investment-grade corporate bond spreads were closer to 200 basis points around the time of the first hike (with a yield of 3.7%) and spreads fell to 100 basis points by early 2018 (before widening throughout 2018). Today, high-quality corporate spreads are already sub-100 basis points—just about their all-time lows—and inching upward, with the investment-grade corporate index yielding a mere 2.8%. Positive gains from yield pickup and spread compression will be harder to come by this time around.
Despite the relatively less attractive yield environment investors face in this hiking cycle, we would still expect our active bond managers to outperform given the majority have significantly less duration than the core bond index. The effective duration (or interest-rate sensitivity) for the Aggregate index is close to 6.75 years today, whereas our active core bond exposure, in aggregate, has slightly shorter rate risk than the benchmark. We maintain our underweight to core bonds in favor of flexible bond managers that have significantly lower duration and higher yields than the benchmark. The same can be said for our tactical exposure to floating-rate loans, which have a duration close to zero. Assuming credit spreads don’t widen significantly as rates rise, we would expect our active bond funds to perform well relative to the core bond index over the course of the year.
A rising rate environment not only affects bonds, but it also impacts equities. Richard Bernstein Advisors (RBA) recently published a paper titled, “Aha! Interest rates do matter,” which provides insights about “equity duration” and the impact rates have on equity prices. The biggest beneficiaries of falling interest rates have been long duration assets, such as a company without a product or service (or profits!) today but that is building for a future that’s ten years away. With all the value of that company in year 10 and zero cash flows between now and then, higher interest rates will heavily impact the valuation investors are willing to underwrite. This valuation re-rating has already started to play out in the small cap growth space (where there are many innovative companies that fit this description). And on the flip side, RBA points out that more cyclical equities tend to outperform in rising rate environments due to their shorter duration and the fact that rates tend to rise when the economy strengthens, which is positively correlated to the earnings of cyclical businesses.
While our portfolios do not have an explicit bet on cyclical businesses today, many blend and value funds we use in portfolios are holding up relatively well. Many active managers retreated from the energy sector (the most cyclical sector) a few years back. However, others have been finding value within the financials sector. Higher rates should positively impact margins at the banks and, in turn, increase earnings. The energy and financials sector are the only two positive returning sectors so far in 2022, while technology and other growth areas of the market have underperformed. As RBA notes: “It seems unrealistic to expect the biggest beneficiaries of falling interest rates to outperform as interest rates rise.”
From the Office of the CIO
US Asset Management – iM Global
Note: For discretionary use by investment professionals. This document is provided by iM Global Partner Fund Management, LLC (“iMGPFM”) for informational purposes only and no statement is to be construed as a solicitation or offer to buy or sell a security, or the rendering of personalized investment advice. There is no agreement or understanding that iMGPFM will provide individual advice to any investor or advisory client in receipt of this document. Certain information constitutes “forward-looking statements” and due to various risks and uncertainties actual events or results may differ from those projected. Some information contained in this report may be derived from sources that we believe to be reliable; however, we do not guarantee the accuracy or timeliness of such information. Investing involves risk, including the potential loss of principal. Any reference to a market index is included for illustrative purposes only, as an index is not a security in which an investment can be made. Indexes are unmanaged vehicles that do not account for the deduction of fees and expenses generally associated with investable products. A list of all recommendations made by iMGPFM within the immediately preceding one year is available upon request at no charge. For additional information about iMGPFM, please consult the Firm’s Form ADV disclosure documents, the most recent versions of which are available on the SEC’s Investment Adviser Public Disclosure website (adviserinfo.sec.gov) and may otherwise be made available upon written request.
Estimated Returns Disclosure
Scenario Definitions:
Downside: The economy falls into a deep recession for any of various reasons, such as deleveraging/deflation, unexpected systemic shock, geopolitical conflict, Fed or fiscal policy error, etc. At the end of our five-year tactical horizon, S&P 500 earnings are below their normalized trend and valuation multiples are below-average reflecting investor risk aversion. Inflation, 10-year Treasury nominal and real yields are below the Fed’s long-term targets.
Base: Consistent with long-term economic and market history, reflecting economic and earnings growth cycles that are interspersed with recessions around an upward sloping normalized growth trendline. Inflation is moderately higher than the Fed’s 2% target level (i.e., around 3%) and 10-year Treasury real yields are slightly positive. For equity markets, we bookend our Base Case with Lower-end and Upper-end estimates:
- In our Base Lower scenario, we assume nominal economic growth is higher than the average due to moderately higher inflation. We assume some additional profit margin compression and moderately lower valuations compared to the Base Upper scenario.
- In our Base Upper scenario, we assume nominal economic growth is higher than average due to both moderately higher inflation and strong real growth. As such, we assume S&P 500 profit margins remain elevated (although below their all-time highs) and valuation multiples are also elevated versus historical averages.
Upside: This is the “Goldilocks” scenario for stocks. S&P 500 earnings end the period well above their Base Case trendline, driven by both higher sales growth and high profit margins. Valuation multiples are well above average and higher than the Base Upper assumption. Inflation is under control, around or slightly higher than the Fed’s 2% long-term target. The fed funds rate is around the Fed’s estimate of “neutral,” the yield curve is positively sloped, and 10-year Treasury real yields are modestly positive.
What the Table Shows: Our five-year, annualized asset class return estimates under several broad economic scenarios. Collectively, the scenarios we use encompass the range of outcomes we believe are reasonably possible and therefore worth considering in creating our portfolio allocations.
Why We Use Scenarios: Considering how each asset class might react under a consistent set of scenarios allows us to calibrate our return expectations across asset classes. We believe this helps us make better asset allocation decisions.
These Scenarios Can Change: As the overall economic environment changes it will at some point necessitate changes to the scenarios we consider. Therefore, there could be times when we are reassessing scenarios and temporarily suspend providing updates for one or more scenarios. When this happens, we will clearly note it and give guidance on when we expect to complete this process.
Any projections provided regarding the likelihood of various investment outcomes are hypothetical in nature, do not reflect actual investment results and are not guarantees of future results. Investing involves risk, including the potential loss of principal, and investors should be guided accordingly.
Related research

November 2023 Monthly Market Update
It was a November to remember. It was an “everything” rally during the month. Record gains in Nove ...
May 2024 Monthly Market Update
Global stock markets rebounded during the month after falling in April. MSCI ACWI jumped 4.6% in M ...
Year-End 2024 Investment Commentary
The U.S. economy and the stock market proved much stronger than many had anticipated in 2024. Ther ...