April 2023 Monthly Market Update
The Month At-A-Glance
- Global equites rose in April amid regional banking stress and worsening leading economic indicators
- Despite the worries, the economy remains resilient and has yet to contract
- Investors waited for the Fed’s early May rate decision—widely believed to the last rate hike in this cycle
- Regulators seized First Republic Bank and sold its assets to JPMorgan Chase
Market Recap
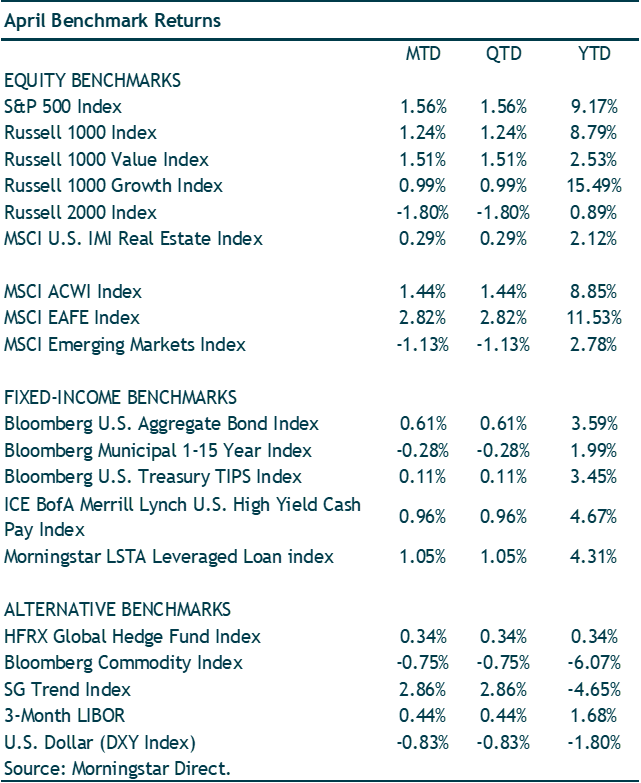
Equity markets rose during the month, led higher by developed markets. European markets outperformed all the main regions with a gain of 4.2%. The S&P 500 returned 1.6% in April. Emerging markets underperformed (down 1.1%) due to weakness in Chinese equities (down 5.2%).
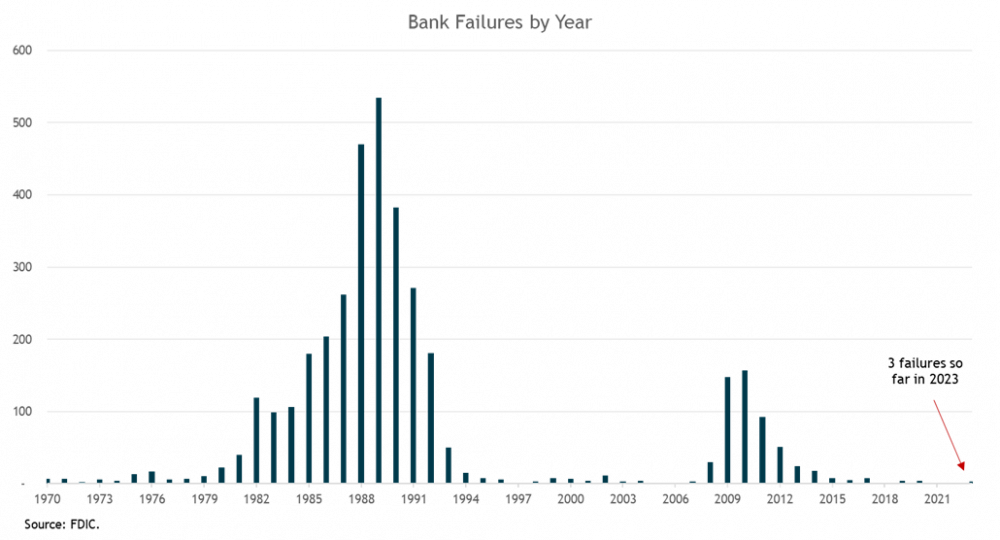
Unlike the bank failures in March, the leadup to First Republic Bank’s failure was largely shrugged off by markets. In fact, at the end of the month, the CBOE Market Volatility Index (VIX) hit its lowest level since 2021. First Republic’s failure is the second largest bank failure in US history and makes it the 3rd bank to enter FDIC receivership since March. Bank failures have been relatively modest over the past decade—and even this years’ failures are significantly less than the thousands of banks that failed during the Savings & Loans Crisis of the 1980s or hundreds of banks that went under in the wake of the Great Financial Crisis.
While the S&P 500 Index is up a strong 9.2% so far this year, the narrowness of the market has been notable. A recent Goldman Sachs report noted that 90% of the S&P 500’s year-to-date return is accounted for by the largest 15 stocks. Look no further than the FANG stocks which have clocked in a return of more than 30% this year. It has paid to own the largest names in the index. The S&P 500 Equal Weighted Index is up just 3.3% this year, nearly 600 basis points behind the S&P 500 (market cap weighted index).
Interest rates were largely unchanged during the month (also reflecting relative disregard for the regional banking issues). The 10-year Treasury rate started the month at 3.48% and ended at 3.44%. The Bloomberg US Aggregate Bond Index gained 0.6%. Riskier credit slightly outperformed the core bond index. The ICE BofA US High Yield market gained 1.0%.
Notable Events
The month was filled with mixed data on the economy as investors waited for the May FOMC meeting. First quarter real GDP growth came in at 1.1%, which was below consensus of 1.9%. It was a notable slowdown from 2.6% GDP growth in the previous quarter. However, first quarter GDP was not a result of weak consumer spending (real personal consumption expenditures increased 3.7% in the quarter). The drag on first quarter GDP was declining business inventories.
Leading indicators on the economy continue to worsen. The Conference Board Leading Economic Index (LEI) declined further in its latest March reading—falling well into recession territory and its lowest level since November 2020. The Conference Board “forecasts that economic weakness will intensify and spread more widely throughout the US economy over the coming months, leading to a recession starting in mid-2023.” According to the Conference Board, there is a 99% probability of a recession in the next 12 months. It very much seems the consensus view is that a recession will happen in the second half of 2023 or early next year. Whether or not that comes to pass (we think it does), the equity and credit markets are not priced for a recessionary environment.
The May 2-3 FOMC meeting was the anticipated event throughout much of April. Despite banking stress and inflation double the Fed’s 2% target, it was largely expected that a 25 basis points increase in the fed funds rate was in the works (bringing the target range to 5%-5.25%). The Fed followed through on this, which is now widely expected to be the final rate hike in the current hiking cycle. The CME futures market has it at a 100% certainty that the Fed will cut rates multiple times between now and the end of the year. This is one of the big divides in the market—the Fed and Chair Powell want to hold rates at these levels for an extended period; however, the market is expecting a U-turn in short order.
Investment Takeaways
We made a strategic asset allocation change in April. We reduced our strategic allocation to emerging-market stocks and reallocated into developed international stocks. The new weights align our strategic allocation with the MSCI ACWI Index (roughly 60% US stocks, 28% developed international stocks, and 12% emerging-markets stocks. For more details see: Strategic Allocation Changes
We did not make any tactical allocation changes. We remain in the camp that a recession in the next 12 months is likely. We are often asked why we haven’t further decreased portfolio risk in the face of an imminent recession. (We reduced our equity exposure by an increment last September.) What’s tricky in the current environment is that many of the leading indicators that investors look at (e.g., inverted Treasury curves or LEI’s) historically flash their warning signs closer to all-time highs in markets. For example, during previous 10s-2s inversions, there was a decent lead time before markets ultimately fell. When the curve inverted in 2019, it wasn’t until February 2020 that the market hit an all-time high. In the cycle before that, the inverted yield curve warning sign went off in 2006 but it wasn’t until the summer of 2007 that the S&P 500 would peak. However, this time, when the 10-year/2-year yield curve inverted in the summer of 2022 the stock market was already down over 20%. Investors heeded the recession warning in real-time.
While we remain cautious about the market and economy, we understand that the “soft landing” scenario is possible (even if the probability is shrinking amid tightening lending standards as a result of the banking issues). But should markets continue higher while economic readings continue to deteriorate, we would likely further reduce risk in portfolios.
Important Disclosure: For discretionary use by investment professionals only. This document is provided by iM Global Partner Fund Management, LLC (“iMGPFM”) for informational purposes only and no statement is to be construed as a solicitation or offer to buy or sell a security, or the rendering of personalized investment advice. There is no agreement or understanding that iMGPFM will provide individual advice to any investor or advisory client in receipt of this document. Certain information constitutes “forward-looking statements” and due to various risks and uncertainties actual events or results may differ from those projected. Some information contained in this report may be derived from sources that we believe to be reliable; however, we do not guarantee the accuracy or timeliness of such information. Past performance may not be indicative of future results and there can be no assurance the views and opinions expressed herein will come to pass. Investing involves risk, including the potential loss of principal. Any reference to a market index is included for illustrative purposes only, as an index is not a security in which an investment can be made. Indexes are unmanaged vehicles that do not account for the deduction of fees and expenses generally associated with investable products. A list of all recommendations made by iMGPFM within the immediately preceding one year is available upon request at no charge. For additional information about iMGPFM, please consult the Firm’s Form ADV disclosure documents, the most recent versions of which are available on the SEC’s Investment Adviser Public Disclosure website (adviserinfo.sec.gov) and may otherwise be made available upon written request.
The [investor] acknowledges that AdvisorIntelligence is beneficially owned by iM Square SAS, a Paris based investment and development platform (“iM Square”). AdvisorIntelligence, from time to time, expects to include in its investment models certain investment funds (collectively, “iM Square Funds”) sponsored or managed by investment advisers in which iM Square has a beneficial ownership interest (“IMGPUS Affiliates”). This arrangement creates a material conflict of interest because AdvisorIntelligence has an incentive to include iM Square Funds in its investment models. IMGPUS Affiliates do not waive fees for these investments. Therefore, assets invested in iM Square Funds will be charged two layers of fees, one by AdvisorIntelligence and another by the iM Square Funds.
Our due diligence process for managers and funds is grounded in our conviction, supported by extensive research, that skilled managers can and do deliver superior performance over the long term. An essential part of the value we provide is the multiple decades of experience we bring to bear in assessing and selecting exceptionally skilled managers. We engage in exhaustive quantitative and qualitative research aimed at uncovering those select managers with an identifiable and sustainable investing edge. Here are just a few critical elements we look for in our due diligence:
- A clearly defined and well-articulated investment process supported by evidence of successful implementation over time
- A manager or team that demonstrates a high level of integrity, intellectual honesty, and a passion for investing
- Supportive team dynamics and a culture that insulates key investment personnel from noninvestment-related responsibilities
- Outperformance versus relevant benchmarks and peers that is consistent with our expectations given certain market environments
- Consistent outperformance (i.e., over rolling periods) versus benchmarks and peers that is a result of a time-tested investment process
This rigorous process yields a select list of managers. For those we decide to invest with, our analysis is not a once-and-done exercise. We continue to closely monitor fund performance and investment decisions through regular updates with our managers, aimed at making sure they remain committed to their investment process and disciplined in its execution and is the basis for the opinions shown below.
Recommended = These are funds we are confident will outperform an index fund alternative over a market cycle.
Approved+ = Approved funds we are actively researching and consider to be realistic candidates for upgrading to Recommended.
Approved = Funds we believe will perform at least as well as, if not in excess of, an index fund alternative over a market cycle.
Noteworthy = Funds we view as promising. The record may be too short, or we may need to do additional due diligence before making a final decision on the status (Approved, Recommended) of the fund.
Under Review = We are currently conducting follow-up due diligence to address questions that have arisen since our last review. While these questions are material enough to warrant further investigation, we do not feel they are material enough to warrant an immediate downgrade.
Recommendation - Index Funds & ETFs
Core = Funds/ETFs that are our preferred vehicle for gaining index exposure to an asset class. These vehicles are recommended for those who would rather use an index fund in lieu of funds in the model portfolios.
Tactical = ETFs and index funds we are currently using or have used in the past for tactical purposes in place of Core funds.
Alternative = Funds we believe are acceptable alternatives to Core funds, though they are not our preferred choice due to any number of factors, including expenses, asset base, index construction and methodology, and the experience of the fund sponsor.
Related research

iMGP Alternative Strategies Due Diligence Report
The iMGP Alternative Strategies fund is a multi-manager, multi-strategy fund that combines alterna ...

Third Quarter 2023 Investment Commentary
After a strong first half to 2023, global equity markets declined in the third quarter. The S& ...

Questions About Managed Futures Allocations
After this year especially, we don’t think there’s a strong argument against including managed fut ...