First Quarter 2023 Investment Commentary
First Quarter 2023 Market Recap
Despite the stress in the banking system, including the second-largest bank failure in U.S. history (Silicon Valley Bank), global equity markets held up remarkably well in March and posted solid returns for the quarter.
The S&P 500 index was up 3.7% in March and gained 7.5% in the first quarter. Developed international stocks (MSCI EAFE Index) did a bit better, rising 8.5% for the quarter (and returned 2.5% in March). Emerging markets stocks (MSCI EM Index) gained 4% for the quarter and rose 3% in March.
Underneath the calm market surface there was wide dispersion in returns across sectors, market caps and styles. Large-cap growth stocks (Russell 1000 Growth Index) gained 14.4% in the quarter, while the large-cap value index returned 1%. The Nasdaq Composite surged 17%, while the Russell 2000 Small Cap Value Index dropped 0.7%. The Technology and Communications Services sectors gained 21.8% and 20.5%, respectively, while Financials and Energy lost 5.6% and 4.7%, respectively.
Fixed-income markets had a strong quarter as longer-term bond yields fell, generating price gains. Core investment-grade bonds (Bloomberg U.S. Aggregate Bond Index) returned 3%, as the 10-year Treasury yield fell to 3.5% from 3.9% at year-end. Riskier high-yield bonds (ICE BofA U.S. High Yield Index) outperformed core bonds gaining 3.7%. Municipal bonds gained 2.3% (Morningstar National Muni Bond Category). Flexible/nontraditional bond funds gained around 3%.
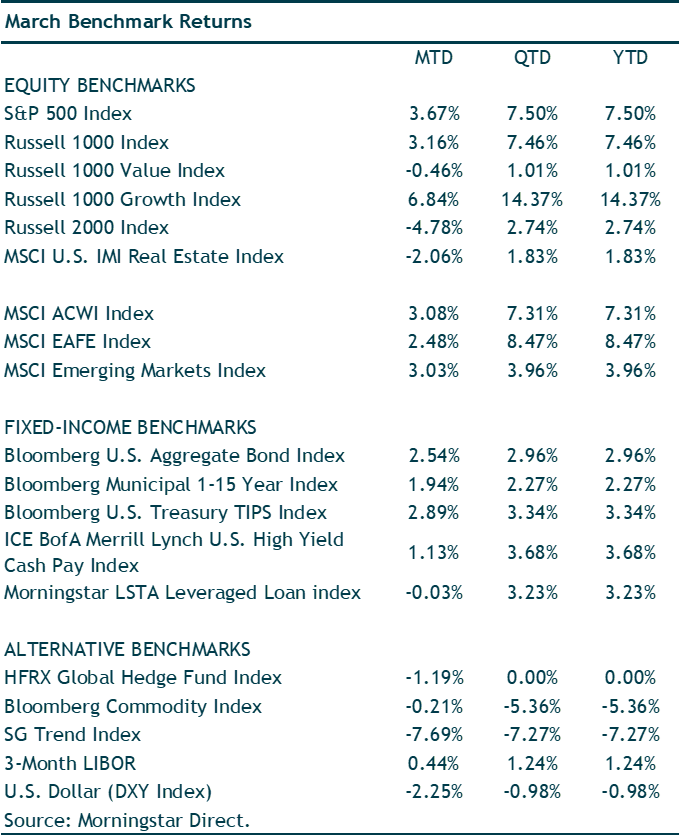
Alternative strategies and nontraditional asset classes generally underperformed traditional stock and bond indexes for the quarter. Trend-following managed futures strategies had a particularly tough period, losing anywhere from 6% to 10%, as some of the major trends from 2022 sharply reversed – particularly interest rates.
Quick Recap: The Silicon Valley Bank Failure – What Happened and Is This the Beginning of Another Great Financial Crisis?
By now, the story of the Silicon Valley Bank (SVB) failure is well known. But we think a quick recap is worthwhile as it sets the stage for our broader discussion of the macroeconomic backdrop and outlook below.
In a nutshell, SVB was a victim of a classic “bank run,” where depositors en masse seek to withdraw their money but the bank doesn’t have the “liquidity” (the cash on hand) to meet their demands.
Importantly, SVB had unique characteristics that made it particularly susceptible to such a run. This is one reason why we and most economists/analysts do not see this as the beginning of a replay of the Great Financial Crisis (GFC) of 2008. But there clearly will be broader economic and financial market impacts, which we will discuss later in this commentary.
While SVB’s situation was unique, the seeds of the bank run, and the broader banking system stress now playing out, were planted with the Federal Reserve’s unprecedented monetary policy stimulus (quantitative easing and zero interest rates) in the years following the GFC and then turbocharged by the pandemic stimulus. The damage has come from the Fed embarking on its most aggressive monetary policy tightening in 50 years – hiking interest rates from 0% to 4.75% over the past 12 months.
As all bond investors painfully experienced last year, sharply rising interest rates caused sharp declines in core bond prices (the worst declines in U.S. bond market history). This includes Treasury bonds and government agency mortgage-backed securities (MBS) – where many banks invested some of their customers’ deposits.
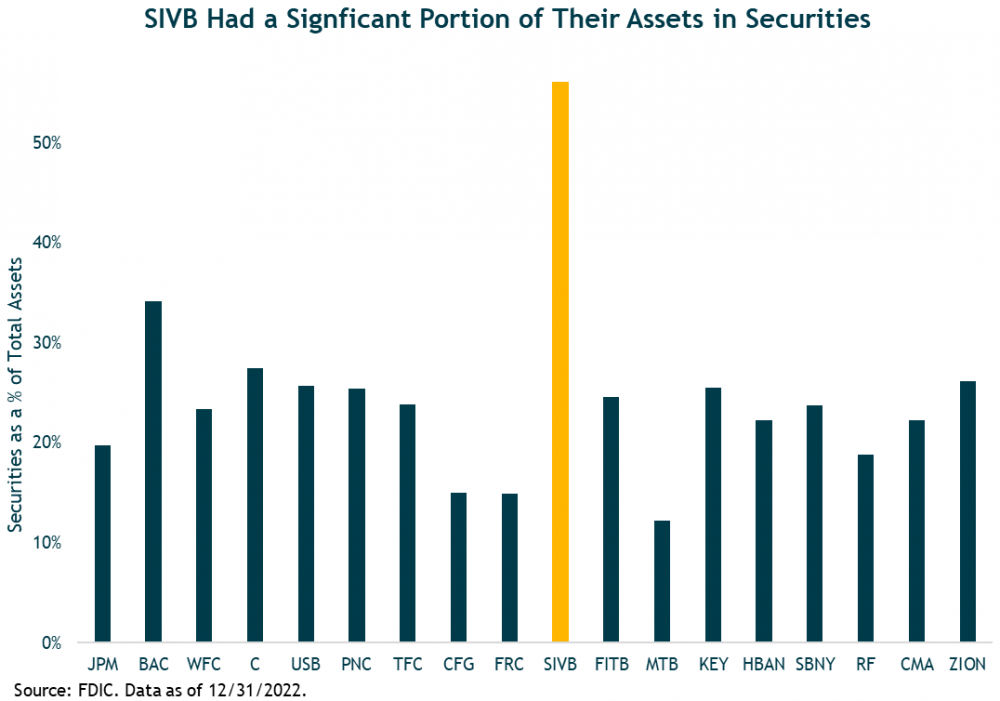
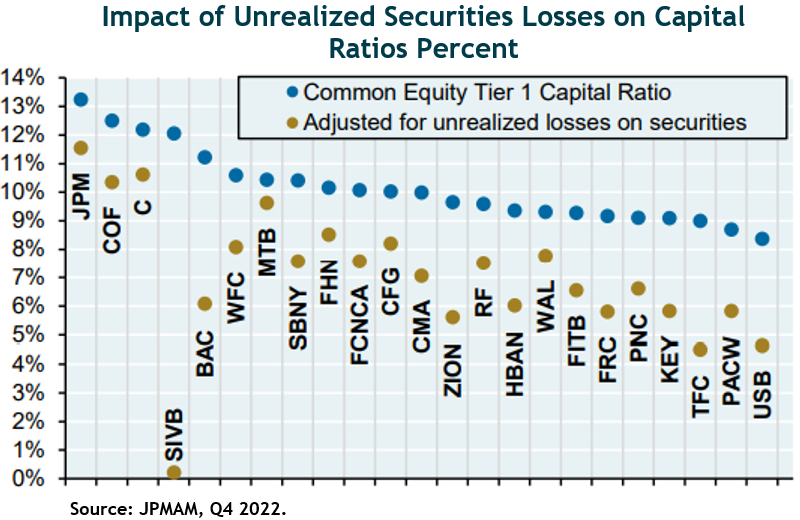
All banks’ bond-holdings have been hurt by the sharp rise in rates/falling bond prices, but SVB was particularly exposed to this interest-rate risk (or bond “duration risk”) as the charts below show. SVB held an unusually large share of its assets in bonds, and those bonds had particularly long duration, i.e., they had a lot of duration risk, meaning their prices (values) were highly sensitive to changes in interest rates. As such, SVB faced extremely large unrealized losses on their bond portfolio, which the bank had purchased when interest rates were much lower/prices were much higher.
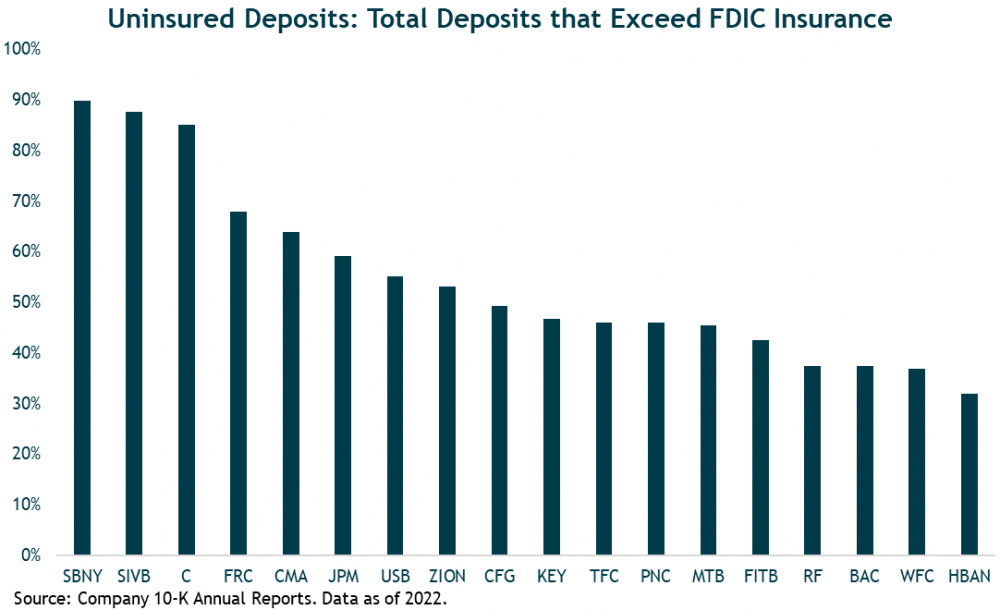
But that’s not all. In addition to SVB’s huge exposure to unrealized losses in its bond holdings, it also had two other unique susceptibilities to a bank run: (1) a highly concentrated depositor base comprised of start-up tech, venture capital firms and the like; and (2) almost its entire depositor base was above the FDIC insurance coverage limit of $250,000 per account. As shown in the chart below. a whopping 90% of SVB’s total deposit base was FDIC uninsured at year-end 2022. (Note that Signature Bank of NY (SBNY), the other regional bank taken over by the FDIC, also had roughly 90% of uninsured deposits.)
Combined, these characteristics of SVB caused some of their concentrated, large, uninsured depositors to start pulling their money from the bank, which in turn forced SVB to raise capital (liquidity) to meet the withdrawals, which meant SVB had to sell bonds at losses (and/or raise equity capital), turning the unrealized losses on their balance sheet into realized losses, raising the question of not only liquidity risk for the bank but solvency/bankruptcy risk, leading to even more depositor flight, etc., until the FDIC and Fed stepped in over the weekend of March 11 to take over the bank, guarantee all SVB deposits above $250,000, and set up a broad banking system liquidity backstop (the Bank Term Funding Program (BTFP)).
The BTFP allows banks to borrow from the Fed for up to a year, based on the issued face value (par value) of their Treasury bonds and agency MBS, rather than the current (lower) market value. This new facility, as well as the Fed’s decision to ease the lending terms on its existing “discount window” short-term (90-day) lending facility, enables banks to meet deposit withdrawals and other liquidity needs without having to sell currently underwater bonds at a loss. As the chart below shows, banks have taken the Fed up on its offer, and then some.
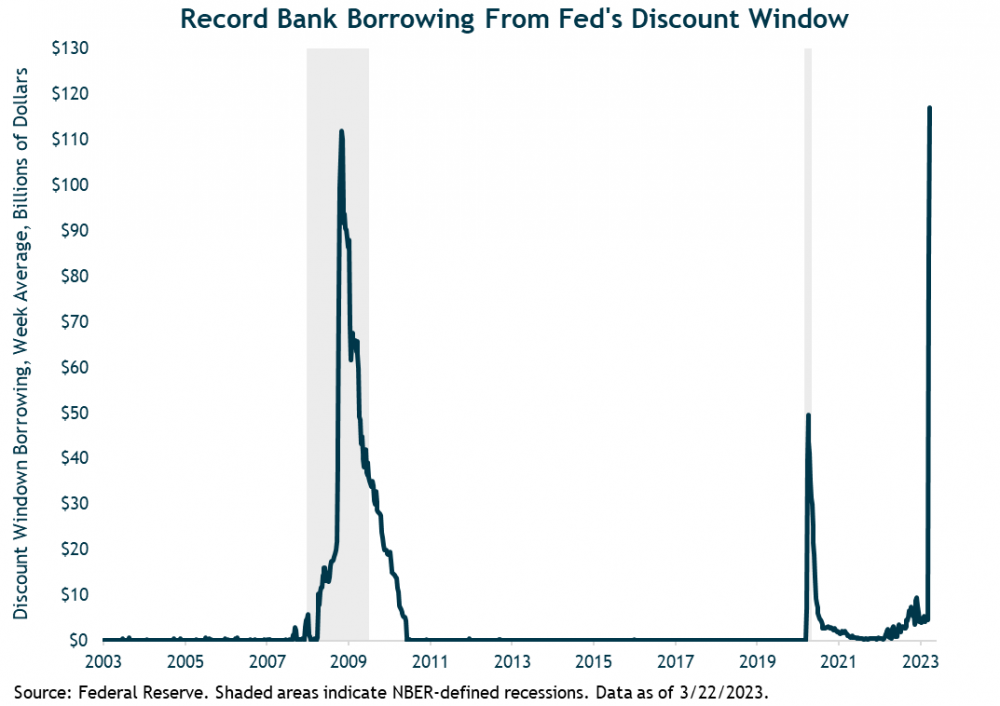
While the banking system is not out of the woods and there may be more smaller-bank takeovers, it seems these steps and subsequent actions from authorities have stemmed the risk of a widespread bank-run contagion.
More broadly, as to why we don’t see this as likely the beginning of “GFC 2.0,” we’d highlight the following key differences between now and then:
(1) The GFC was the result of a self-reinforcing negative spiral involving credit risk and counterparty risk. Banks and other financial institutions lent hugely to unqualified borrowers (e.g., NINJA mortgages to homeowners with no income/no job/no assets) and the systemic risk was multiplied by the pervasive creation of financial derivatives based on such shoddy loans (and even derivatives on the derivatives). As housing prices fell, the value of these loans collapsed and banks had insufficient capital to handle the declines. This led to a credit crunch, which further fed the housing price decline and economic downturn, leading to further losses on loan values, further bank insolvency, etc. etc.
This time, the problem is not caused by poor lending standards (credit risk), exploding derivatives and weak bank balance sheets (although poor management of the failed banks is a common theme), but instead interest rate duration risk from the banks’ Treasury and agency bond holdings, whose values plunged as interest rates soared. There is no risk of default – no credit risk - in Treasuries and government agency MBS.
Further, in the current situation, as core bond yields have subsequently fallen in response to risk aversion and macro fears caused by the SVB crisis, the value of banks’ high-quality bond holdings have increased (unrealized losses have lessened). So, this seems more of a self-limiting feedback loop, very different from the self-perpetuating adverse feedback loop of the GFC.
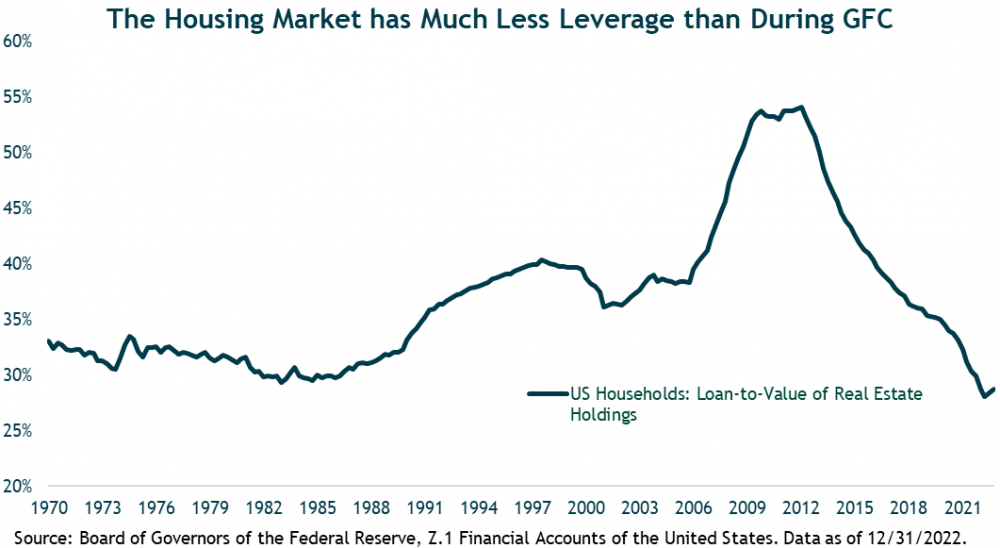
(2) U.S. consumers in aggregate are now less leveraged and lending standards were tightened, especially in the housing market where regulations since the GFC have reduced loan-to-deposit ratios and raised loan qualification standards.
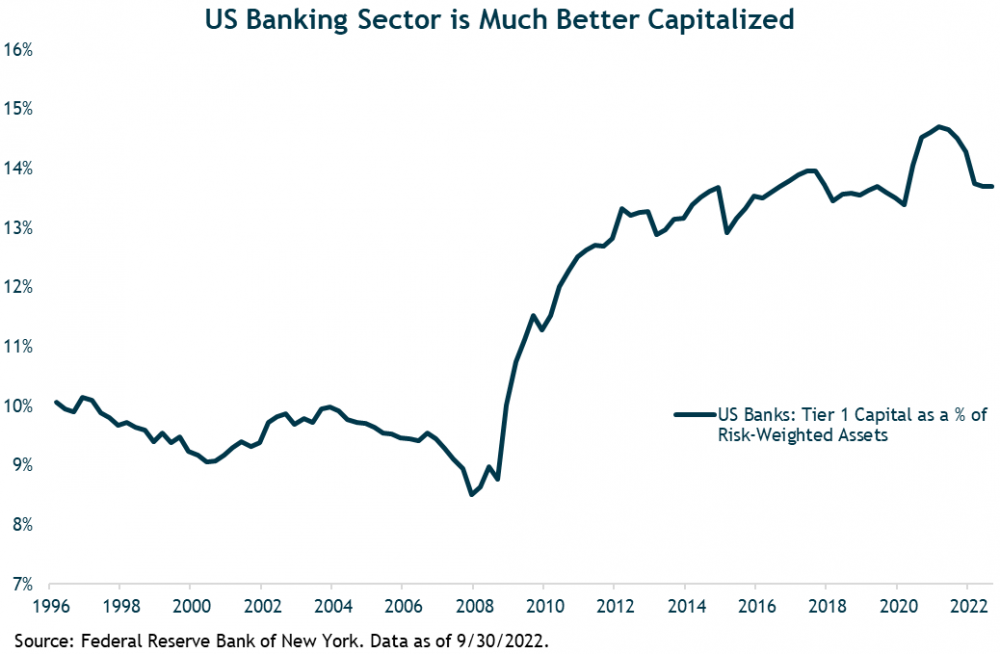
(3) Banks are better capitalized now, particularly the very largest “systemically important” banks, due to tighter regulations since the GFC.
(4) Having lived through 2008, the authorities (Fed, FDIC, Treasury) have acted relatively quickly and forcefully to stem the systemic contagion risk.
In the sections below, we provide an update on the macroeconomic environment, followed by our assessment and outlook for the financial markets.
Macro Outlook for 2023: Recession Remains our Base Case with Small Chance of a Soft Landing
As usual, we frame the macroeconomic backdrop and outlook across two dimensions: inflation and GDP growth.
The bottom line is this: (1) U.S. inflation remains too high, but very likely to decline significantly over the year; (2) U.S. economic growth is well below trend, and although positive in the first quarter is likely to tip negative later this year with a recession likely.
Inflation
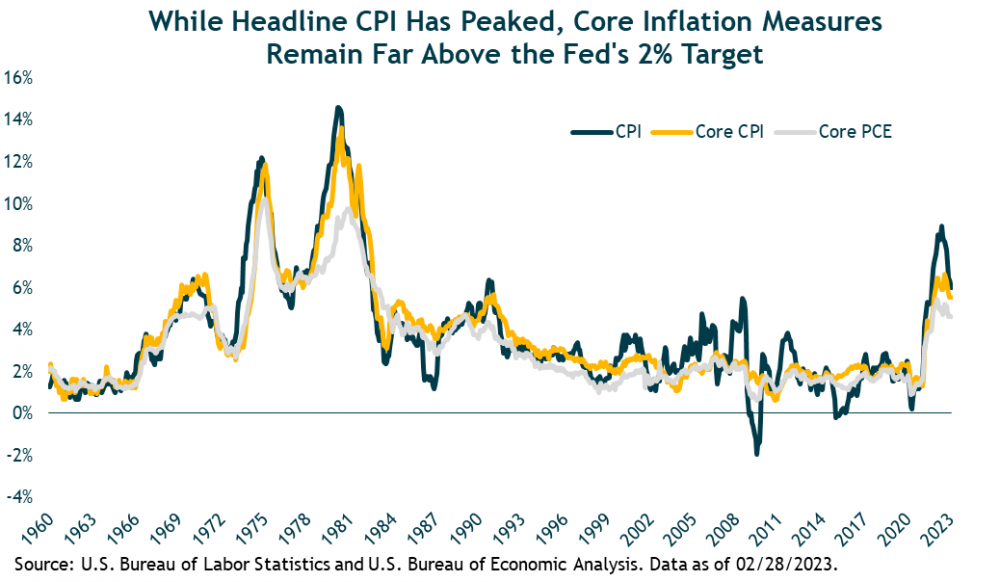
Although inflation peaked last year and has come down, it remains much too high for the Fed’s 2% long-term target. February’s year-over-year core CPI inflation rate was 5.5%, while core CPE inflation – the Fed’s preferred measure - clocked in at 4.6%.
As we noted at year-end, it is the services component of inflation that is the concern now; price hikes for consumer goods have dropped dramatically as supply and demand have come into balance after the pandemic-era dislocations.
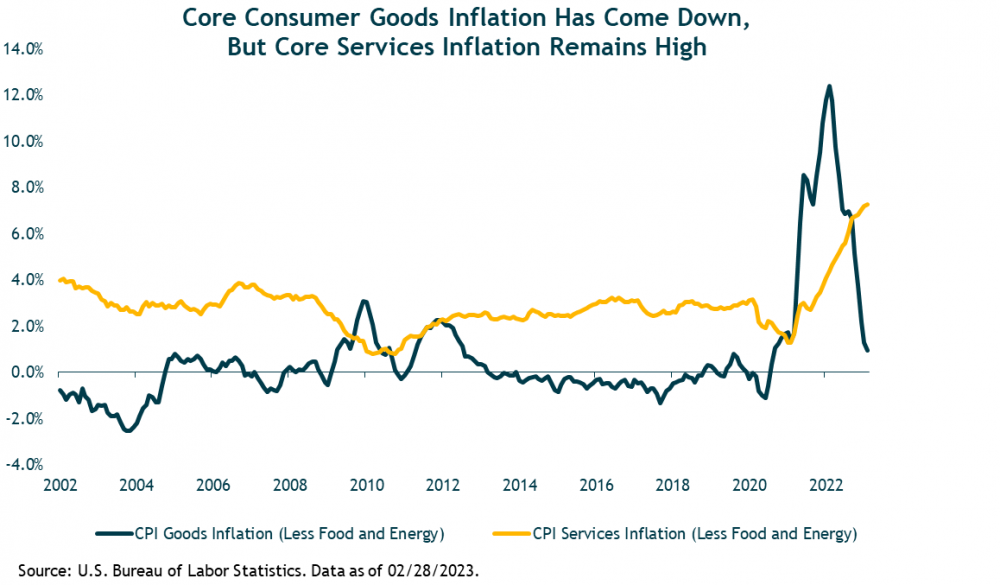
There are good reasons to expect core CPI services inflation to recede as the year goes on. The largest component of the core services inflation basket is shelter, which includes housing rental prices. Given the slowdown in the housing market over the past year as well real-time measures of rent declines, most economists expect shelter inflation to moderate over the course of the year.
But even removing shelter from the core CPI services inflation measure - a metric that Fed Chair Powell has recently emphasized – this so-called “supercore” inflation stood at 6.1% year-over-year in February.
The Fed
As such, the Fed has continued its rate hiking campaign this year, although the magnitude of the rate hikes has diminished. At its March 22 FOMC meeting, the Fed hiked its federal funds policy rate by 25 basis points (0.25%) to a range of 4.75% to 5.0%. This was the consensus expectation (and our expectation), although a meaningful portion of market participants thought the Fed might not hike at all given the upheaval in the banking sector. But the Fed’s inflation concerns won out over worries about exacerbating the banking stress.
This was the Fed’s ninth consecutive hike since March 2022, representing a total tightening of 475bps (4.75 percentage points). As noted above, this is the most aggressive monetary policy tightening campaign since the Paul Volcker days in the early 1980s. It was inevitable something (in this case SVB and other poorly managed banks) would “break” given the magnitude and speed of the hikes.
The Fed is still hoping they can land the economy softly without causing much more damage, let alone a recession. It’s not impossible, but the odds are low and history is not on their side given the complexity of the task and the multitude of economic and behavioral variables outside of their control.
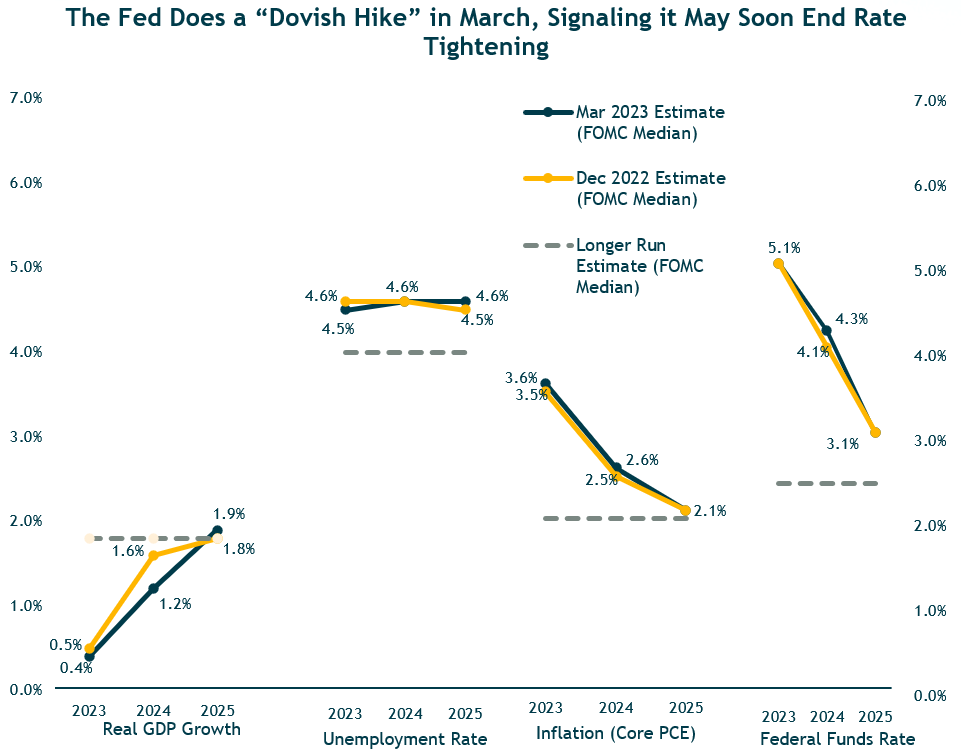
As of the March meeting, the median FOMC participant projects just one more 25bp rate hike this year to a range of 5.0% to 5.25%, and then 75bps of rate cuts in 2024. The FOMC median projects core PCE inflation falling to 3.6% this year and 2.6% by the end of 2024. If the Fed projections play out (a big if), that implies a real (inflation adjusted) fed funds rate of 1.5%, which the Fed would consider restrictive/tight. The Fed’s assumption for the long-run “neutral” (neither loose nor tight) real fed funds rate is 0.5%, comprised of 2% core inflation and a 2.5% nominal fed funds rate.
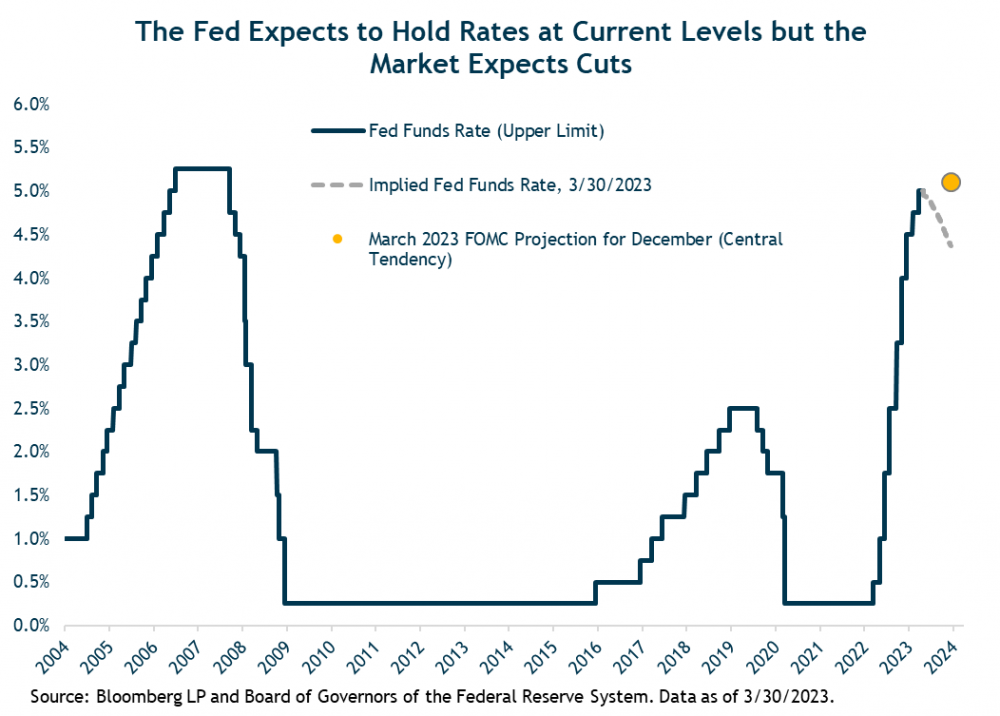
At his March FOMC press conference, Powell reiterated that he and his Fed colleagues do not expect to cut rates this year. However, the fed funds futures market doesn’t believe him; it is currently pricing-in roughly 75 to 100bps of Fed rate cuts this year. It seems the futures market is implicitly assuming an economic slowdown, recession or crisis that forces the Fed to sharply ease. One thing is certain: the fed funds futures and the Fed projections can’t both be right on this.
Referring to the banking system stress, the March FOMC statement said, “Recent developments are likely to result in tighter credit conditions for households and businesses and to weigh on economic activity, hiring and inflation. [emphasis added] The extent of these effects is uncertain.”
Powell also remarked that the likely tightening in credit conditions “in a way, substitutes for rate hikes. … As a result, we no longer state that we anticipate that ongoing rate increases will be appropriate to quell inflation; instead, we now anticipate that some additional policy firming may be appropriate.” [emphasis added] However, Powell also reiterated, “Inflation remains too high, and the labor market continues to be very tight.”
The Labor Market
The largest input cost for most businesses, and services businesses in particular, is wages. Wages in turn are partly a function of inflation expectations, which can feed into a self-reinforcing wage-price spiral — the Fed’s biggest fear.
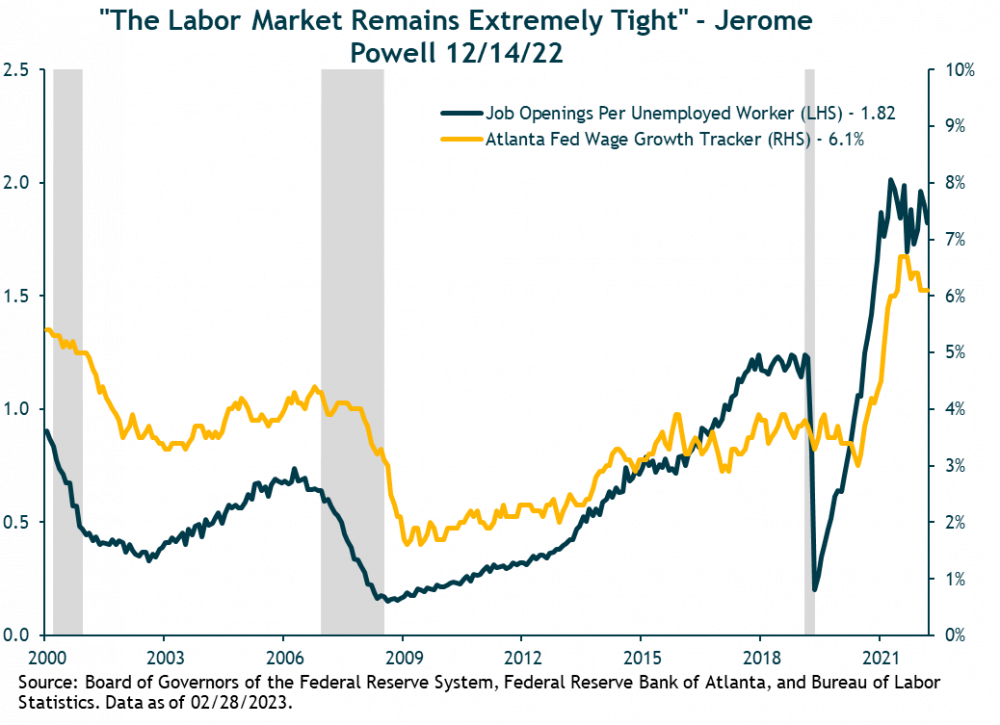
While wage inflation appears to have peaked and has started to fall, February’s 6.1% year-over-year wage growth reading is still much too high to be consistent with the Fed’s 2% core inflation target.
Put differently, the labor market still is too tight (as Jerome Powell has repeatedly said); there is too much demand for workers relative to their supply. The ratio of Job Openings to Unemployed workers is one measure of labor demand (job openings) versus supply (unemployed workers). It remains near all-time highs, with 1.9 job openings per unemployed worker. As shown in the chart below, there is a strong positive relationship between this ratio and wage inflation.
The Fed’s hope is that tighter monetary policy will reduce the number of job openings, relieving the pressure on wages without causing a big increase in actual layoffs and unemployment. That’s a possibility given the unprecedented number of job openings relative to very low unemployment (and maybe also some questionable robustness of the job openings data). But it’s not our base case. We’d also point out the Fed itself is projecting roughly a 1% increase in the unemployment rate this year. This is a significant increase and based on historical relationships would imply the economy falls into a recession.
Inflation Expectations
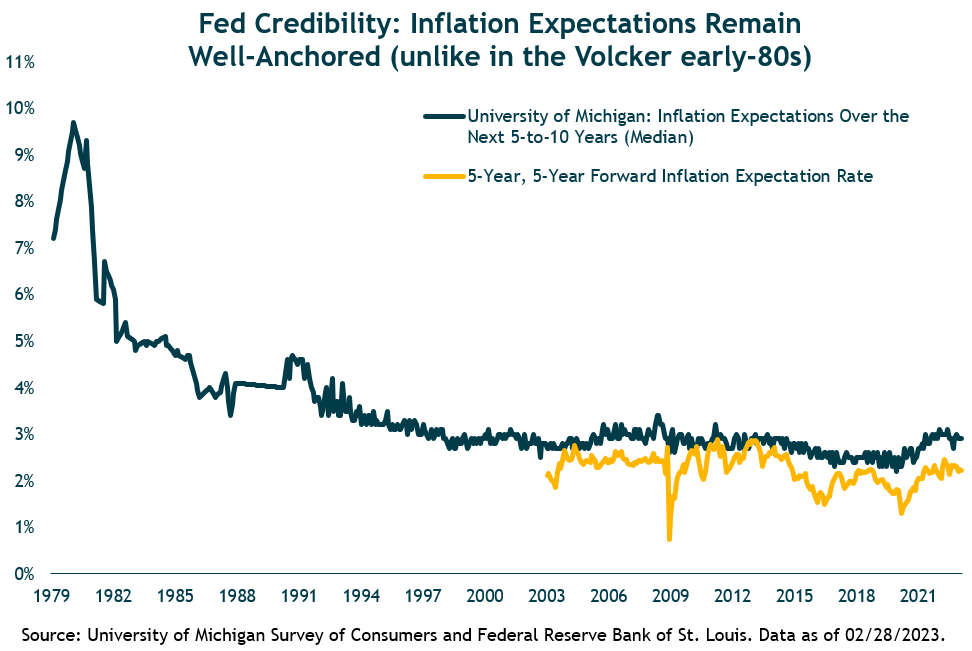
A significant bright spot in the inflation picture continues to be the stability of medium- and longer-term inflation expectations, which, as shown in the chart below, have remained in the 2-3% range, right where the Fed wants them. Shorter-term inflation expectations, which are more volatile and highly sensitive to gasoline prices, have also dropped.
Inflation expectations are crucial, because if they become un-anchored they can feed into a self-reinforcing, inflationary wage-price spiral - where wage and price hikes feed into higher inflationary expectations which feed into further wage and price hikes, etc. This was the inflationary regime that Fed Chair Paul Volcker had to break in the early 1980s with double-digit interest rates.
Economic Growth
With above-normal inflation and the Fed sharply tightening, the short-term outlook for economic growth was already poor coming into the year. Add to that the negative impact from tighter credit conditions due to the recent banking stress, and the growth outlook has gotten worse. How much worse isn’t clear. But it definitely hasn’t improved the chance of avoiding a recession this year.
The FOMC’s updated economic projections from March (see earlier chart) showed a further reduction in their GDP growth expectation for 2023, to just 0.4%. Given the first quarter’s GDP growth will likely be solidly positive, this implies negative GDP growth for the rest of the year.
(In December, when the FOMC was projecting 0.5% GDP growth for 2023, we wrote: “We’d never expect the Fed to project a recession, but their latest forecast is about a close as it gets.” In March, they got even closer!)
The FOMC left its unemployment rate forecast roughly unchanged at 4.5% for this year. If that occurs, history strongly suggests a recession is likely. Since 1950, there has never been an instance where the U.S. unemployment rate increased by a half percentage point or more from its cyclical low without an accompanying recession. The unemployment rate bottomed at 3.4% in January 2023 and was 3.6% in February.
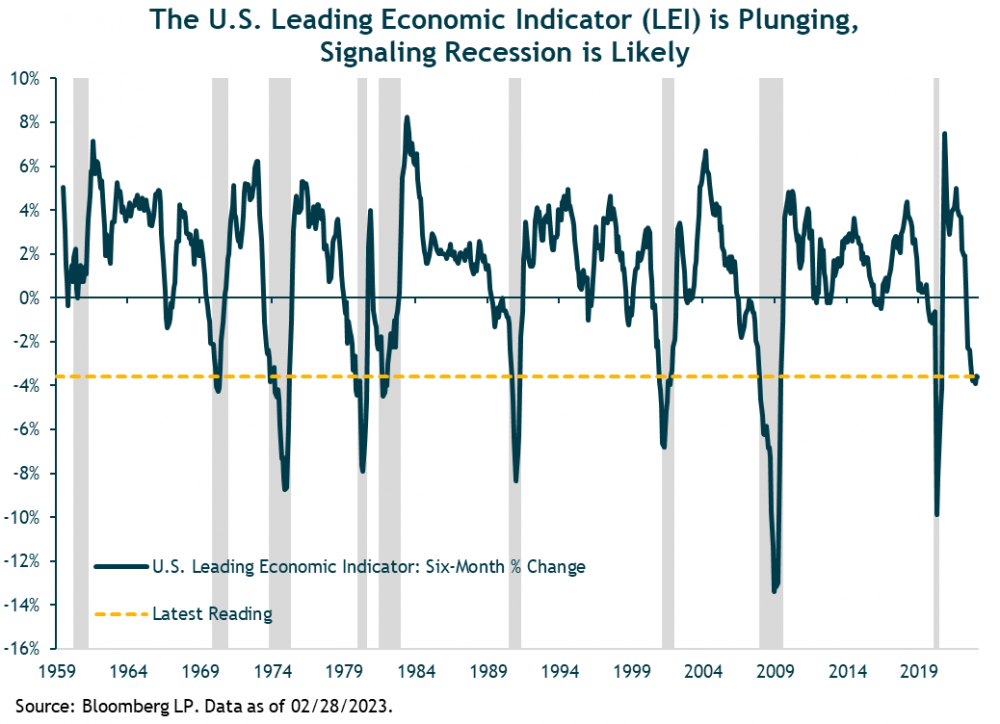
In addition, two leading indicators with long track records continue to signal a recession is coming sooner than later. The Conference Board Leading Economic Index (LEI) has declined for 11 straight months and its rate of change is clearly in recessionary territory. As we’ve said before: No economic or market leading indicator is 100% predictive. But in terms of recession probabilities, based on the weight of the evidence, we believe the odds are tilted strongly in that direction.
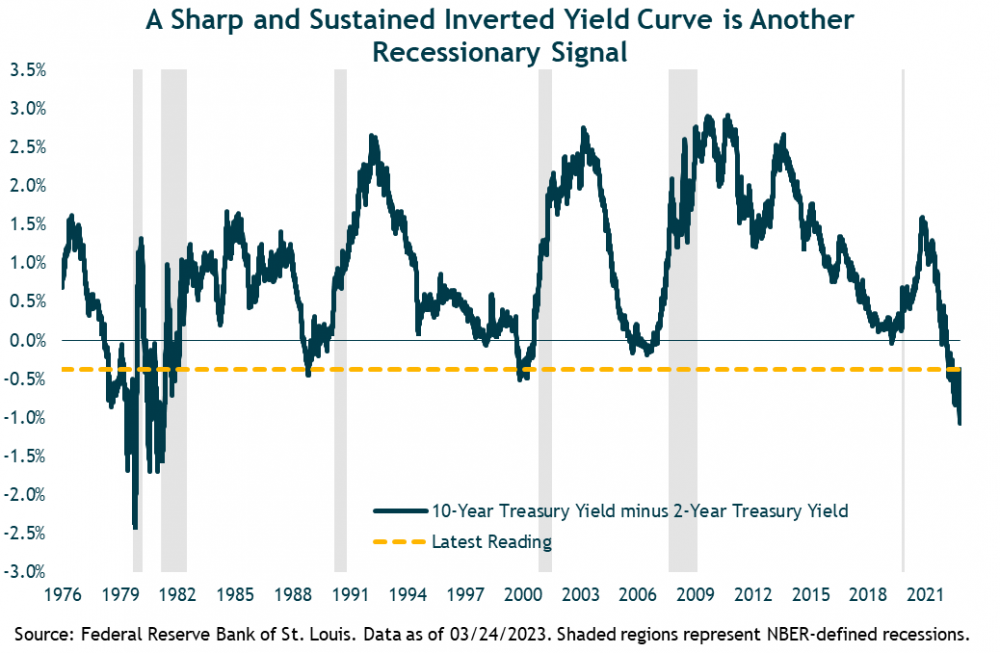
The second recession indicator is the inverted Treasury yield curve – meaning short-term Treasury yields are above longer-term Treasury bond yields. An inverted yield curve is unusual and usually (but not always) a leading indicator of recession. Also, the timing from initial curve inversion to the onset of recession has been highly variable. But as with the LEI, the current degree of inversion has never occurred without a subsequent recession in the U.S.
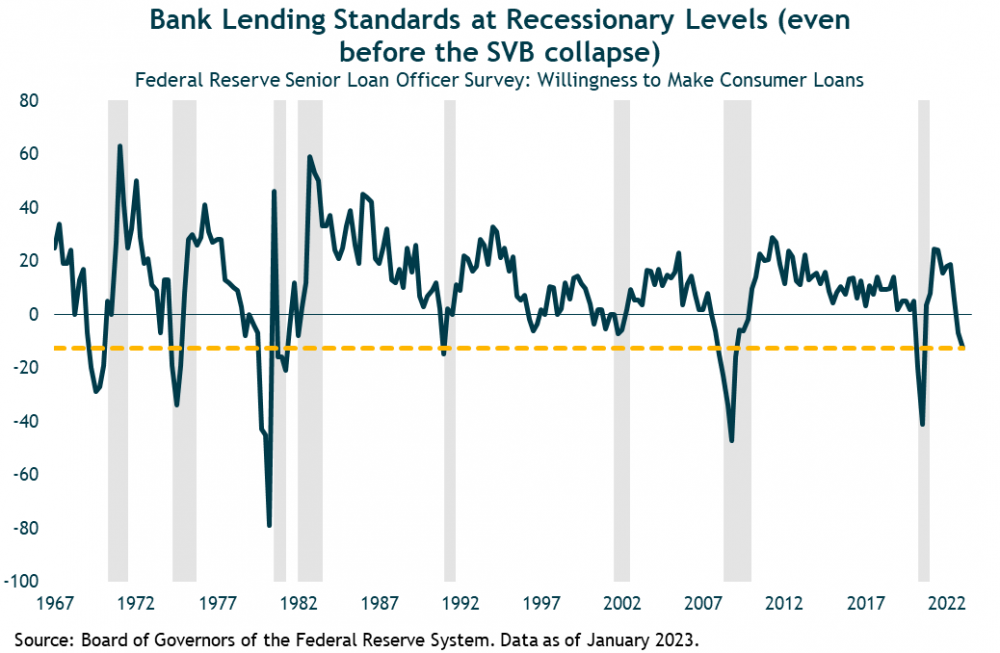
With the banking system turmoil, we will add another historical recessionary indicator to our list: bank lending standards. Bank lending standards are a leading indicator of credit conditions, which in turn impact economic growth. The chart below shows the results of the Federal Reserve’s long-standing Senior Loan Officer Survey through January 2023. It shows there had been a sharp tightening in consumer lending standards even prior to the SVB collapse, to levels consistent with recession in previous instances.
There seems little doubt that bank lending standards and credit conditions will tighten further in the days and weeks ahead as most banks conserve capital and liquidity, boost deposit rates (to retain deposits fleeing to higher-yielding money market funds) and generally face higher overall funding costs.
That will weigh on business investment and consumer spending, i.e., overall economic growth. For example, Goldman Sachs’ economists estimate that tighter lending standards among small and midsize banks will cause a ¼ to ½ percentage point drag on U.S. GDP growth this year than would otherwise have been the case. (Interestingly, Goldman Sachs is still one of the (few) economists/strategists that are not forecasting a recession this year as their base case. However, they did increase their odds of recession given the banking system stress and tighter credit conditions.)
However, all is not gloom and doom for the economy. And, because the future is inherently uncertain, we always consider a range of scenarios when forming our investment views and constructing diversified investment portfolios.
On the positive side, as we noted above, the U.S. and other major global economies appear to have grown in the first quarter of the year. The Purchasing Managers Indexes (PMI) that we often refer to improved in February and March, indicating the U.S., Europe, Japan and China are all currently in expansionary territory (PMIs above 50). The Economic Surprise indexes for these regions are also in strongly positive territory, indicating recent economic data points in aggregate have been much better than the consensus expected. Household and business balance sheets remain healthy and supportive of continued spending. U.S. households are still sitting on an estimated $1.4 trillion in pandemic-era savings. Employment remains robust, with a stronger than expected 311,000 new jobs (nonfarm payrolls) in February, following the shockingly strong 504,000 jump in January. Real disposable income is rising as wage growth is now stronger than CPI inflation. Even if a recession plays out, these are all reasons to believe it may be relatively mild (although that is little solace to anyone who loses their job as result).
Macro bottom line
A U.S. recession this year is not a certainty. But weighing the evidence as we see it, we believe recession is still the most likely outcome, and has become more likely with the banking system stress of the past few weeks.
Financial Markets Outlook and Portfolio Positioning
Equity markets
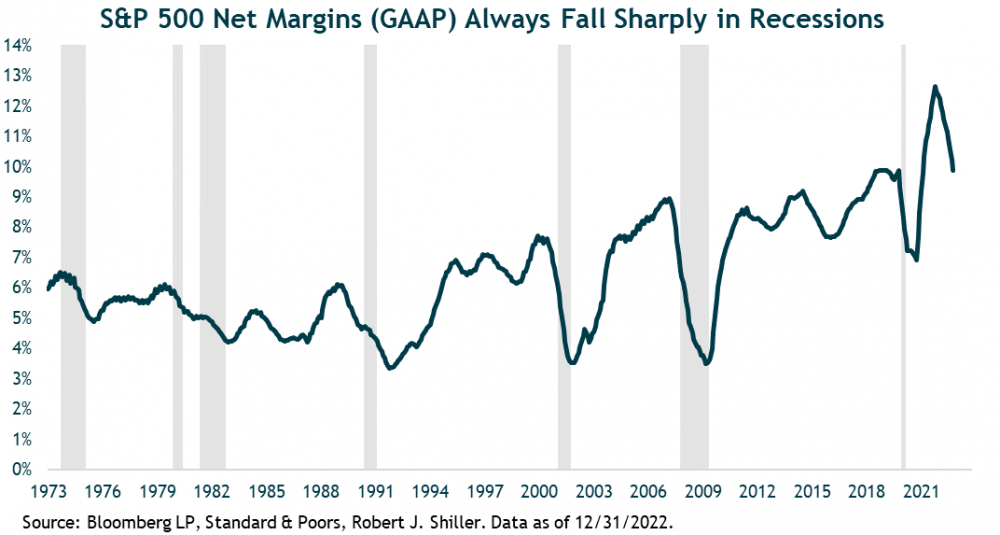
In an economic recession, it is almost certain corporate earnings will decline, i.e., an “earnings recession.” S&P 500 index earnings typically decline around 15% to 20% (peak-to-trough) during economic recessions as both sales growth and profit margins compress. In a mild recession, the earnings decline might be closer to 10% to 15%. Yet, the current consensus earnings expectations for 2023 do not reflect nearly that magnitude of decline; nor do current stock market valuations.
As such, our assessment of the U.S. equity market (S&P 500 index) has not materially changed from the end of the year. We do not believe the S&P 500 is adequately discounting the likelihood and severity of an oncoming earnings recession. In fact, despite the recent banking turmoil, the S&P 500 is actually higher than it was at year-end.
If our base case earnings recession scenario plays out, there is a strong likelihood that the S&P 500 index will materially decline from current levels. As we’ve shown in our recent commentaries, we assess potential shorter-term downside for the S&P 500 in the 2700 to 3200 range. From its current level around 4100 that implies a potential bear market on the order of 20% to 30%.
As a reminder, in September we reduced our equity exposure and added to core bonds in our balanced portfolios. The stock market is several percentage points higher than where it was when we made that decision. Although the odds of recession have now increased in our view due to the banking system stress and its impact on lending/credit, the market has not (yet) risen enough – gotten overpriced enough – for us to further reduce our equity exposure. However, the “trigger point” for us to tactically reduce our equity exposure by another increment (3-5%) is closer now, given our view that the odds of a recession have increased.
As long-term investors, it is critical not to get caught up in the day-to-day noise, news headlines (almost always designed to attract attention rather than inform) and general volatility of the financial markets. This is why we analyze expected returns for major asset classes over a medium-term (five to 10-year) horizon and include a range of scenarios to account for the uncertainty.
Long-term investment success requires minimizing the role of emotions in investment decisions. Emotions will lead most of us to want to chase (buy) asset classes or funds with recent strong performance and flee (sell) when prices are dropping. Put succinctly: that is buying high and selling low. While it may feel good in the moment, it’s a recipe for poor long-term investment results.
Often, the best long-term investment decisions feel the most uncomfortable at the time you make them. That’s the way financial markets work. Or, as Warren Buffett put it, “The stock market is a device for transferring money from the impatient to the patient.”
The near-term is always uncertain and often can be scary – there are always lots of things to worry about in the world. Keeping one’s eyes on the medium-to-longer-term “most likely” outcomes is a key investment discipline.
Our current base case five-year expected return estimates for equities are very similar to where they were three and six months ago. We see U.S. stocks likely to generate mid-single digit annualized returns over the period, which assumes a recessionary bear market happens. This is a decent but not great expected return for U.S. stocks given their risks. It is also inferior to our five-year return expectations for developed international and emerging markets (EM) equities of high single to low double-digit annual average returns.
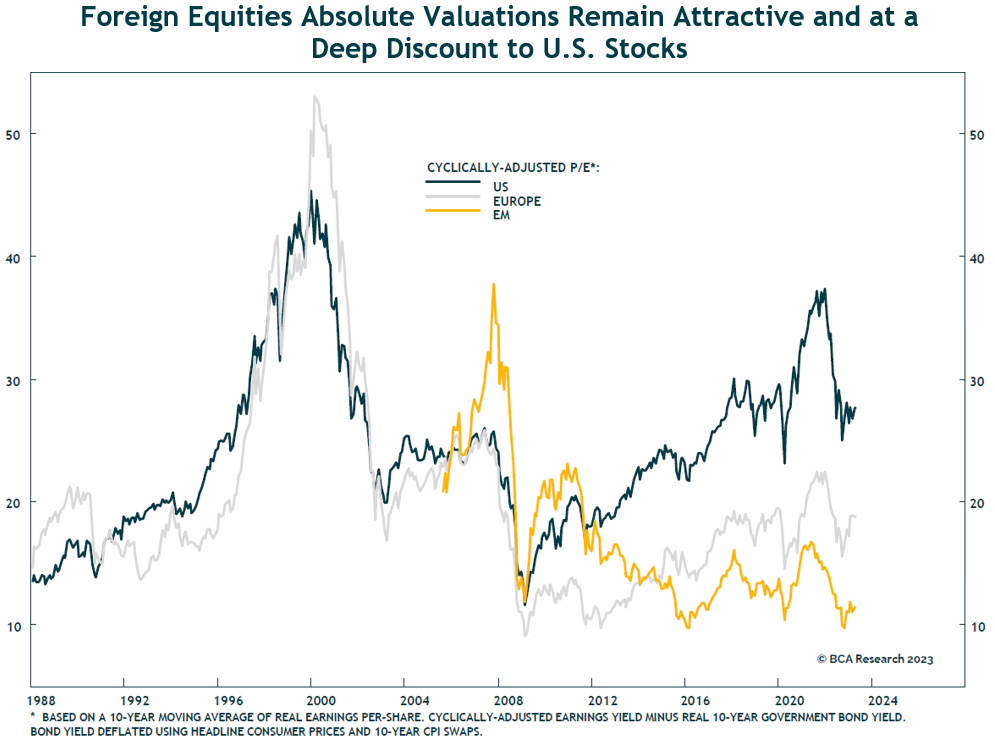
Among the three regions, we tactically favor EM stocks right now based on their higher expected returns, which are a function of what we expect will be faster sales growth and improving profit margins over the next several years. This comes after more than 10 years of stagnant EM earnings growth. We also expect some improvement in the valuation discount between EM and US indexes, although we assume EM will still sell at a large discount (a lower P/E multiple) to the U.S. (roughly 32% in our base case), given EM’s macro risks.
Finally, we expect the U.S. dollar to decline versus most other currencies over the medium-term, which would further add to EM and international equity returns for dollar-based (unhedged) investors.
When the U.S. stock market declines to levels that offer more compelling medium-term returns and adequately discount shorter-term risks, we will look to add back exposure by selling more-defensive assets (bonds). This typically happens during a recession when investor pessimism and fear are widespread. Eventually, stocks bottom out then start to rebound as investors anticipate an earnings growth recovery. And the next cycle and bull market begins.
Fixed Income/Core Bonds
In addition to the risk of an earnings recession not being adequately discounted in U.S. stock index prices, the other key reason for our tactical portfolio changes in September was the significant rise in core bond yields, making them much more attractive from a risk and return perspective than they had been in years.
The yield on the core Aggregate Bond Index was around 4.75% when we made our changes in September. Now, at the end of March, the yield is down slightly to 4.4%. In terms of our portfolio positioning, this is not a material change (although there has been a huge amount of day-to-day bond market volatility during this period). Like our U.S. equity outlook and positioning, we are not making any tactical changes to our fixed-income allocations.
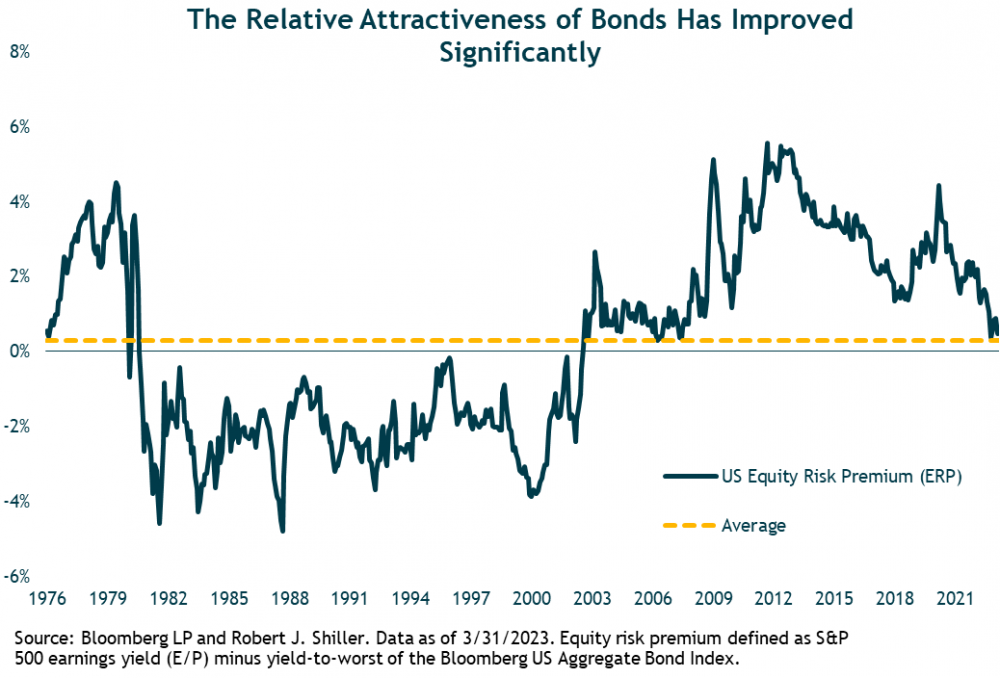
The relative valuation/attractiveness of U.S. stocks versus core bonds (known as the “equity risk premium”) continues to slightly favor bonds relative to historical averages, as shown in the first chart below. To revert to a more normal, i.e., higher, equity risk premium will require either a decline in equity valuations, lower bond yields, or some combination of the two.
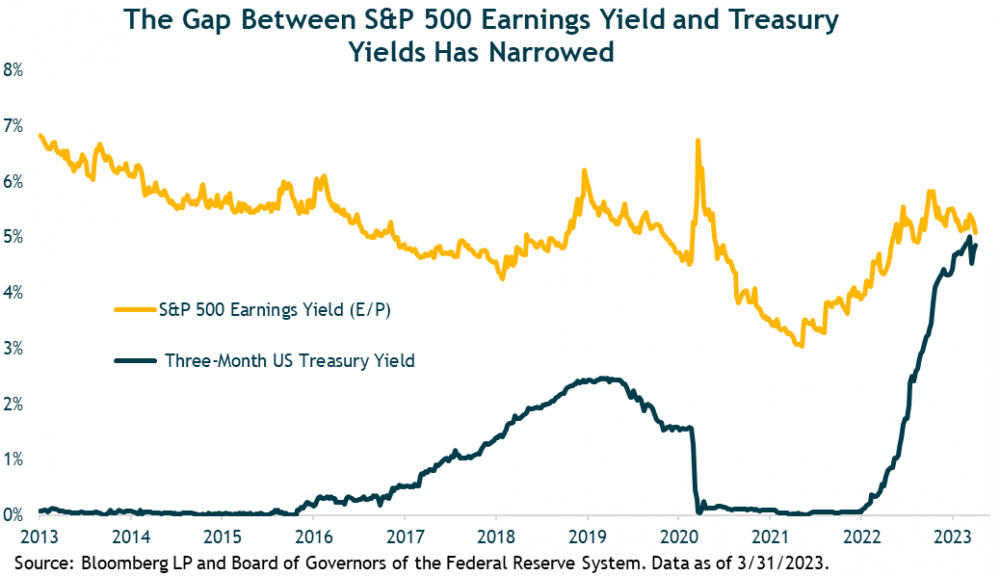
As the Fed has continued to raise short-term interest rates, the yield premium between stocks and “cash” (short-term Treasury bills) has shrunk even further since year-end, as the second chart below shows. It’s possible that if we tactically reduce our stock exposure by another increment we’d put the proceeds into cash.
In addition to our core bond exposure, we continue to have a meaningful allocation to higher-yielding, actively managed, flexible bond funds run by experienced teams with broad investment opportunity sets. There are many fixed-income sectors outside of traditional core bonds that offer attractive risk-return potential, and we want to access them via our active managers.
Marketable (Liquid) Alternative Investments
Finally, we maintain core positions (5% in a typical balanced portfolio) in trend-following managed futures funds. Managed futures returns were very strong in 2022 while traditional bond and stock investments fell double digits. This year has seen sharp reversals in some major market trends – the most significant being the decline in Treasury bond yields – that have caused short-term losses in trend-following funds. This is not at all surprising given the nature of these strategies; but losses are never fun.
Again, we’d keep our focus on managed futures’ powerful long-term portfolio benefits in providing alternative and non-correlated returns relative to traditional stock and bond holdings. Trend following strategies are also much less dependent than traditional investments on any particular macro environment. They can perform well whether the macro backdrop is deflationary, inflationary, stagflationary, or growth-oriented. Our conviction in owning these strategies remains high.
Closing Thoughts
We believe 2023 will present us with some excellent long-term investment opportunities. Unfortunately, in our base case we also expect we’ll first have to go through a recessionary bear market with a potentially significant drop in global equity prices.
While a recessionary bear market is our base case, we do not rule out the possibility the U.S. economy avoids recession this year, or that the recession is mild, and stocks do not drop as sharply as we expect in our base case.
A lot still depends on the Fed and how much further they tighten (raise rates). If the Fed pauses their hiking campaign sooner than later, equities may positively respond (at least over the short-term), as lower interest rates imply higher P/E multiples. But there are numerous other key variables for the economy and financial markets that are beyond the Fed’s or any policymaker’s control. The recession may be pushed out to 2024 but we doubt it’s been rescinded.
Even with a recession as our base case near-term scenario, we currently see attractive medium-term expected returns from international and emerging markets stocks – better than what we expect from the U.S. market. As such, we have a relative overweighting to equities outside the U.S.
Fixed-income assets and high-quality bonds are also now attractively priced with mid-single digit or better expected returns, depending on duration and credit quality. Core bonds will also provide valuable portfolio ballast in the event of a recessionary bear market. Our investments in alternative strategies and managed futures funds should provide further resilience to our portfolios.
Finally, we want to give a heads up that we recently completed a review of our long-term strategic asset allocations to U.S., developed international, and emerging-market stocks. As a result, we plan to implement changes to our strategic asset allocations at the end of April which will impact our current equity positioning. At a high level, we plan to align our strategic equity exposure to be more in-line with the global equity market capitalization of the MSCI ACWI index, the industry-standard global equity benchmark. Importantly, while the changes to our strategic allocations will impact our current positioning, our tactical views remain the same, i.e., we remain overweight to EM stocks. The directional effect of these changes is an increase to the allocation to developed international stocks, and a lower strategic weighting to emerging markets. More details to come when we roll out the changes.
Important Disclosure: For discretionary use by investment professionals. This document is provided by iM Global Partner Fund Management, LLC (“iMGPFM”) for informational purposes only and no statement is to be construed as a solicitation or offer to buy or sell a security, or the rendering of personalized investment advice. There is no agreement or understanding that iMGPFM will provide individual advice to any investor or advisory client in receipt of this document. Certain information constitutes “forward-looking statements” and due to various risks and uncertainties actual events or results may differ from those projected. Some information contained in this report may be derived from sources that we believe to be reliable; however, we do not guarantee the accuracy or timeliness of such information. Past performance may not be indicative of future results and there can be no assurance the views and opinions expressed herein will come to pass. Investing involves risk, including the potential loss of principal. Any reference to a market index is included for illustrative purposes only, as an index is not a security in which an investment can be made. Indexes are unmanaged vehicles that do not account for the deduction of fees and expenses generally associated with investable products. A list of all recommendations made by iMGPFM within the immediately preceding one year is available upon request at no charge. For additional information about iMGPFM, please consult the Firm’s Form ADV disclosure documents, the most recent versions of which are available on the SEC’s Investment Adviser Public Disclosure website (adviserinfo.sec.gov) and may otherwise be made available upon written request.
Estimated Returns Disclosure
Scenario Definitions:
Downside: The economy falls into a deep and sustained recession for any of various reasons, such as deleveraging/deflation, unexpected systemic shock, geopolitical conflict, Fed or fiscal policy error, etc. At the end of our five-year tactical horizon, S&P 500 earnings are below their normalized trend and valuation multiples are below-average reflecting investor risk aversion. Inflation and 10-year Treasury nominal and real yields are very depressed.
Base: Consistent with long-term economic and market history, reflecting economic and earnings growth cycles that are interspersed with recessions around an upward sloping normalized growth trendline. Inflation is at or moderately higher than the Fed’s 2% target level and 10-year Treasury real yields are around zero percent to slightly positive. For the S&P 500, we now bookend our base case with a lower-end and upper-end estimate:
- At the lower end of our base-case fair-value range, reflation efforts are successful and nominal economic growth is higher than the average. However, the economy overheats, and valuation multiple and some margin compression largely offset the favorable macro backdrop.
- At the upper end, reflation efforts are also successful, nominal economic growth is higher than observed since the 2008 financial crisis on average, profit margins move slightly higher, and valuation multiples are also slightly higher than the recent historical average.
Upside: S&P 500 earnings end the period well above their long-term (base case) normalized trendline. Valuation multiples are well above average and higher than the upper end of our base case. The Fed exits its accommodative policy without major economic or market disruptions, although a normal recession within the five-year period is still possible. Inflation is around or moderately higher than the Fed’s 2% average target. Real 10-year Treasury yields are around zero percent to negative as the Fed succeeds in keeping rates from materially rising.
What the Table Shows: Our five-year, annualized asset class return estimates under several broad economic scenarios. Collectively, the scenarios we use encompass the range of outcomes we believe are reasonably possible and therefore worth considering in creating our portfolio allocations.
Why We Use Scenarios: Considering how each asset class might react under a consistent set of scenarios allows us to calibrate our return expectations across asset classes. We believe this helps us make better asset allocation decisions.
These Scenarios Can Change: As the overall economic environment changes it will at some point necessitate changes to the scenarios we consider. Therefore, there could be times when we are reassessing scenarios and temporarily suspend providing updates for one or more scenarios. When this happens, we will clearly note it and give guidance on when we expect to complete this process.
Any projections provided regarding the likelihood of various investment outcomes are hypothetical in nature, do not reflect actual investment results and are not guarantees of future results. Investing involves risk, including the potential loss of principal, and investors should be guided accordingly.
Resources
Related research

iMGP High Income Alternatives Fund Due Diligence Report
The introduction of the iMGP High Income Alternatives Fund in late 2018 was motivated by several f ...

AdvisorIntelligence Q4 2022 Client PowerPoint Presentation Now Available
The latest AdvisorIntelligence Client PowerPoint presentation is now available.

April 2023 Monthly Market Update
Equity markets rose during the month, led higher by developed markets. European markets outperform ...