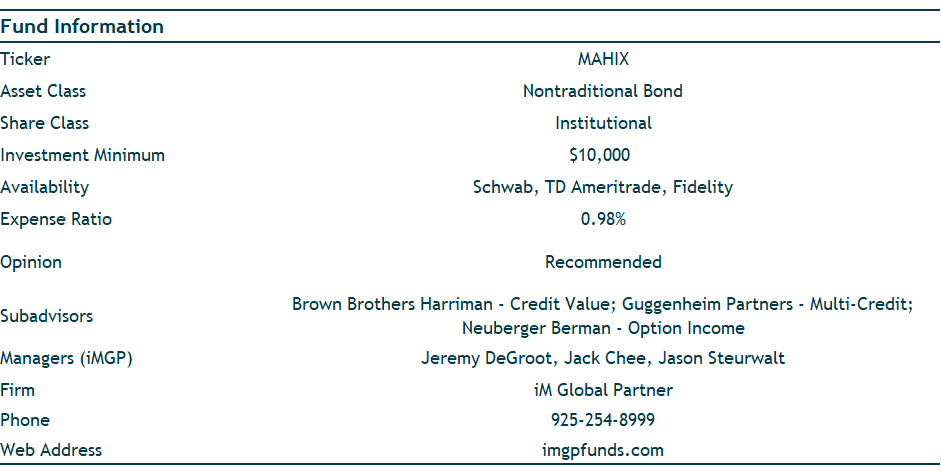
iMGP High Income Alternatives Fund Due Diligence Report
Fund Overview:
The introduction of the iMGP High Income Alternatives Fund in late 2018 was motivated by several factors. First and foremost, when considering whether to create a new fund, we view it through the lens of our affiliate Litman Gregory Asset Management’s (LGAM) role as an independent investment advisor and fiduciary, managing diversified portfolios for our clients. We want to ensure that there are clear and compelling fundamental reasons for the fund to exist, and that it merits a meaningful strategic allocation in our client (and personal) portfolios.
Second, the asset-management team at iM Global Partner has been investing in income-oriented strategies beyond traditional core investment-grade bonds for many years, and we have developed expertise in the space. We wanted to leverage this experience to create an income-focused fund with investments that could generate attractive returns, while playing an important role in navigating risks that come with interest-rate and credit cycles. Combining our expertise and experience in non-traditional income strategies and our access to top-tier managers, we saw an opportunity to build a distinctive, income-focused fund at a competitive fee.
We designed the fund to be a strategic part of an investor’s diversified fixed-income allocation, offering access to proven managers with expertise in non-traditional income markets and niches. We believe the fund has the potential to generate higher returns over a full market cycle, while adding diversification and mitigating interest-rate and credit risks. We seek to generate an attractive level of income consistent with capital preservation, meaning that we want to maximize income within the context of prudent risk management. Over time, we expect the fund to generate returns that are competitive with high-yield bonds but with less downside volatility. We also expect the fund to potentially outperform traditional core bonds over most three- to five-year rolling periods.
In our portfolios we use the fund as a long-term strategic allocation that complements our traditional core bond exposures and other income-oriented investments. Advisors might also use the fund to diversify and replace some of their high-yield (or higher-yielding) fixed-income allocations or traditional equity-income allocations. Given our fund’s income objective, it may be beneficial in enhancing yield in portfolios for income-focused clients, or as part of endowment or trust portfolios that have recurring income-distribution. The fund could also serve as part of an alternative strategies allocation, although we would note that the fund is likely to have more short-term downside than a “pure” alternative strategy that actively and consistently hedges market exposure.
Constructing the Fund
In creating this fund, we drew upon our 30-plus years of asset-class and manager research. Our search for subadvisors involved managers we knew well but also strategies run by managers with whom we were less familiar. Important to us was identifying strategies that can achieve high levels of income within a prudent risk-reward framework—we did not want yield for yield’s sake. Today the fund has three teams that we believe run compelling strategies that are diverse in terms of process and opportunity set but similar in that they share the goals of high-income generation and risk awareness.
Our exposure to Brown Brothers Harriman (BBH) as a firm began in 2010 when we began to evaluate the firm’s Core Select fund, a domestic larger-cap equity strategy. Over time, we conducted due diligence on their fixed-income teams, both taxable and municipals. Specifically, we researched their Limited Duration fund, a short-term cash-plus strategy, and their intermediate-term municipal bond fund. We also gained meaningful exposure to the structured credit team. Given our confidence in the team and their focus on attractive risk-adjusted returns within non-traditional credit, we spoke to them about a flexible credit strategy, where they would also have the flexibility to buy structured credit, corporate bonds, and loans. BBH has a separate account (Credit Value) that employs this strategy and had close to a four-and-a-half-year track record when we launched the fund. Our deep knowledge of the firm, the strategy, and the investment team allowed us to recommend BBH as a subadvisor to the iMGP High Income Alternatives Fund.
Our research on Guggenheim Investments dates back to mid-2014. Our initial due diligence focused on two of their mutual funds, Macro Opportunities and Total Return Bond. This research involved extensive contact with numerous members of Guggenheim’s investment team in both their New York (corporate credit team) and Santa Monica (portfolio-management and structured credit team) offices. Our ongoing contact with the team included numerous calls and face-to-face meetings with over 20 senior investment-team members, including multiple conversations with many of the individuals. This contact resulted in a great deal of respect for the individuals and their collaborative investment process, which focuses on generating attractive risk-adjusted returns in all market environments. Our discussions with Guggenheim related to the iMGP High Income Alternatives Fund sought to provide them greater flexibility to implement their best thinking, while maintaining their risk-conscious approach.
Neuberger Berman (NB) traces its roots back to 1939, and while it has changed ownership several times during its history, today it is a private, independent, 100% employee-owned global investment manager. The firm manages nearly $460 billion of assets across a broad set of strategies ranging from long-only equity and investment-grade bonds through structured credit, hedge funds, and private equity.
Within Neuberger Berman, the put-write strategies are managed by a team of four investment professionals, with the support of additional firm resources such as operational, trading, and technology. They currently manage approximately $6 billion across several variations of equity index-based put-writing. The lead portfolio manager, Derek Devens, has been researching, managing, and refining the strategy for seven years, starting when he was an analyst and portfolio manager at Horizon Kinetics. Portfolio managers Rory Ewing and Eric Zhou joined Devens approximately eight years ago at Horizon. The team joined NB in 2016 and has grown the option-writing business to its current size with a mix of clients including public pensions, foundations, high-net-worth individuals, and a mutual fund.
We first spoke with Devens in 2015 when he was still with Horizon, as part of a very preliminary survey of potential income strategies. When evaluating Devens and the strategy for this fund, our research included numerous calls with Devens and Ewing; in-person meetings both in our office and at the NB office in New York; reviews of the strategy’s live track record, historical model-based back-tested returns, and the performance of the Chicago Board Options Exchange (CBOE) S&P 500 PutWrite Index (“the Put Index,” which we reference below), an index based on a very basic form of the strategy; and additional research on options strategies (primarily put-writing) and volatility products from both academia and industry sources. This resulted in our positive view on the strategy in general, along with a high level of comfort in Devens’s specific approach to executing it. We are confident in the team as good stewards of investor capital and thoughtful portfolio management. Although the strategy depends more on structural market dynamics for success rather than a “star” portfolio manager, the approach and actual execution make a meaningful difference (positive or negative) when compounded over time.
The Sub-Advisors
Brown Brothers Harriman
Investment Philosophy and Process
The BBH team seeks to protect investors’ capital and generate attractive risk-adjusted returns in the Credit Value strategy. They strive to achieve this investment objective through bottom-up fundamental analysis and by investing in a long-term manner. The strategy primarily seeks opportunities from a wide variety of sectors including corporate bonds (investment-grade and below-investment-grade) and asset-backed securities (ABS). The portfolio is relatively concentrated in securities believed to have the greatest return potential. Interest-rate exposure is driven by the risk/return potential of the yield curve, i.e., are they getting paid sufficiently to go longer on the curve. The macroeconomic environment is a consideration but is viewed from the perspective of risk-management as opposed to opportunity related.
The BBH fixed-income investment philosophy is grounded in a few key insights. First, credit valuations across fixed-income sectors historically offer compensation well in excess of default-driven losses. Second, credit spreads are more volatile than the underlying fundamentals, which creates a favorable environment for active management. Third, they believe a patient and long-term approach is necessary to deliver superior total returns.
The Credit Value strategy focuses on structured and corporate securities. Their emphasis is on BBB/BB-rated securities, as they have historically offered attractive excess returns, along with low default rates and limited downside: These segments of the market have historically offered the best Sharpe ratios. The believe layering on active credit selection within these credit ratings enhances this opportunity. (The team rarely owns CCC-rated securities or distressed securities.) The team also highlights that rules-based buyers and sellers often must transact (buy or sell) securities based on changes in these credit ratings (for example, a below-investment-grade manager may be forced to sell an upgraded credit, or vice versa). The volatility around these ratings transitions is something the team tries to exploit.
When defining risk, BBH thinks about risk as permanent capital loss, not volatility. In their minds, volatility provides opportunity.
The team’s appetite for credit risk is valuation driven. When valuing securities/credits, and assessing an attractive margin of safety, BBH applies the same valuation approach across all sectors—for example, ABS, commercial mortgage-backed securities (CMBS), corporate credit, and municipal bonds. They seek to exploit mispricings created by short-term price volatility, providing the opportunity to buy securities at discounted valuations with a sufficient margin of safety. Investments are only made when the team believes a security’s potential return more than compensates them for default risk, liquidity risk, and the embedded optionality of a bond. When attractive opportunities are not available in the marketplace, the team will hold reserves.
The team uses option-adjusted spread (OAS) analysis, as opposed to other common valuation metrics such as yield-to-worst (YTW) or yield-to-first-call (YTC). While each yield metric provides an indication of relative value via yield spread over a similar maturity risk-free yield, the issue is that the yield must be presented with a term. In contrast to a non-callable bullet bond, where the maturity is known, the cash flows of a callable bond depend on the path of interest-rate moves. The issue here being that the future path of interest rates or when a bond will be called is an unknown, which clouds the accuracy of yield quotes for callable bonds. This is because cash flow assumptions must be based on an assumed term, which may or not play out as there is no guarantee of when a bond will be called, if at all.
This uncertainty is part of why BBH believes using option-adjusted spread analysis is superior to other measures of relative value. The option-adjusted spread is the difference between a credit’s yield relative to the yield of a similar-maturity point on a risk-free curve (the Treasury curve). This spread is measured in basis points (bps) and equates the present value of a series of cash flows of a bond to make the bond’s price equal to that of a similar-maturity point on the curve. This is an analysis of a credit’s cash flows using hundreds of hypothetical interest rate scenarios. A constant spread is added to the interest rate, which together is used to discount the average present value of all the hypothetical cash flows calculated. This process is repeated until the average present value is equal to the current market price of the credit. Thus, the OAS is the spread to the curve (duration equivalent) that causes the average present value of the credit’s cash flows to equal the current market price.
In practice, the team’s valuation process starts with the concept that credit spreads mean revert: Spread deviations relative to a long-term average indicate potential spread compression or spread widening. The team applies this valuation framework to all economic sectors (for example, utilities, industrials, financials) by credit rating and maturity. For example, the team may look at AA-rated three-year utility securities. Should the sample size within a sector/rating cohort be too small to draw conclusions around value, the team will make adjustments such as rolling limited data sets into adjacent cohorts.
From there, they observe the average OAS over time and use one-half standard deviation above and below the average OAS to identify a strong signal of whether spreads are wide or tight. A wider-than-average spread in and of itself does not designate a security as a buy. If a security is identified as attractive, the team will develop a more detailed valuation analysis. The first three factors are benefits, while the last three factors are potential costs:
- Carry. This is basically the spread over a maturity-matched Treasury bond.
- Mean reversion. If a credit’s current OAS is considered wide, to be conservative, the team assumes spreads revert to the upper bound of the half-standard deviation band, instead of reverting back to the mean. Conversely, the team assigns a higher penalty to securities that trade tight, by assuming spreads do revert back to the mean.
- Credit spread roll-down. Roll-down occurs as a credit ages. For example, over the course of a year, a five-year bond becomes a four-year bond. As bonds mature and “roll down” the yield curve, the yield declines with the passage of time due to the inverse relationship between price and yield. This factor is typically an incremental positive.
- Liquidity. This measure is based predominantly on the bid-ask spread, which is the price difference between the highest price a buyer is willing to pay and the lowest price at which a seller is willing to sell. The less liquid a bond, the more spread the team demands. To estimate this cost, the team multiples the bid-ask spread times the security’s spread duration. The team thinks about liquidity costs in the context of the market environment. In an “average” regime, the bid-ask will be in the mid- to upper-single-digit range. But in bear markets, the bid-ask spread could widen, and the team would likely use a wider bid-ask to estimate liquidity costs. The traders have input into this.
- Default costs. This is the expected cost due to the probability of default: loss given default times the probability of default. This data is obtained from external resources who publish the probability of default by sector, capital structure, and ratings.
- Spread volatility cost/optionality. The team makes a qualitative assessment of a volatility cost based on the economic sector, credit rating, effective duration, etc. The more uncertainty around a credit, the higher the volatility assumption. The team uses conservative volatility assumptions as appropriate given the market conditions and their conservative mindset. The higher the volatility assumption, the higher the assumed cost of the call option since the option becomes more valuable given the market uncertainty. Therefore, the spread of the bond’s yield over a comparable maturity is reduced.
Summing these components together to arrive at a net expected excess return and comparing the result to their estimate of fair value is how the team assesses the attractiveness of a credit’s valuation.
Fundamental research is the foundation of the investment process. When it comes to identifying credits for potential inclusion in the portfolio, there are four fundamental criteria the team requires: a durable operating model, effective management, attractive/appropriate structure, and transparency. The qualitative factors underlying these criteria vary slightly based on asset class. The requirements for durability can vary between a corporate and structured credit.
A durable credit is one where the team believes an issuer’s revenue stream and its financial structure can withstand a wide range of economic and regulatory scenarios. In BBH’s opinion, there are several characteristics that contribute to a credit’s durability. For example, the durability criteria for corporate issuers includes essentiality of product/service and strong competitive position, while the durability of a structured credit might be defined by debt that can withstand multiples of projected collateral loss. The team does not invest where outcomes are binary, are surrounded by meaningful uncertainties, or are reliant on optimistic forecasts to be solvent. The team also avoids new industries that aren’t time-tested, where this is no evidence of how the industry could perform in a downturn (for example, rooftop solar and marketplace lending ABS). BBH utilizes stress testing as part of their assessment of a credit’s durability. When stress-testing, BBH first develops what they believe are conservative baseline assumptions for a credit. Then the team requires that a security hold up to 250% of that base-case loss without any impairments to principal or interest.
When assessing management, the team looks for issuers with a long, proven track record of execution (especially through a downturn), commitment to capital markets access, and incentives that are aligned with creditors’ interests.
Regarding appropriate bond structures, the team requires that the level and variability of an issuer’s revenues comfortably support ongoing operations and the capital structure. The team ensures that issuers are not overly dependent on financial markets and have appropriate maturities and covenant protections. When it comes to transparency, the team demands detailed and timely information of collateral performance to evaluate and understand the issuer and the credit. Management must also be accessible.
Portfolio Construction
Bottom-up credit selection drives portfolio construction. The portfolio’s exposure to sectors, geographies, credit quality, etc., are purely the result of the team’s fundamental and valuation analysis. The team does not attempt to benefit from top-down calls, such as on changes in the yield curve or thematic views, or mirror benchmark exposures. The strategy’s duration is flexible, where the team seeks to maintain a duration that is consistent with positive returns over longer time periods. U.S. Treasury futures can be utilized to manage duration, which allows security selection to be managed independent of portfolio duration. Stress tests are performed at the portfolio level to understand the effects of rate changes.
The BBH team does not derive a false sense of security from diversification. Their confidence is based on thorough underwriting and attractive valuations. Their Credit Value portfolio will typically hold roughly 80 issues, spread across fewer obligors (50-60), making the strategy relatively concentrated. The top 10 credits are expected to account for 20%–25% of assets. They own securities for the long term.
Position size is mostly determined by the valuation model. The more attractive the expected excess return, the larger the position. Position size is usually limited to 3% for this strategy. The team will add to positions if they feel the market unjustifiably punishes a high-conviction name. Similarly, the team trims as their expected compensation declines: They do not hold a position at full size until it reaches their sell target. Typically, position sizes are down to 0.25% at the time a security reaches the sell point. Under normal circumstances, portfolio turnover should average 20% to 25% per year.
When attractive credit opportunities or valuations are not available in the marketplace, they will hold liquid reserves. These liquid reserves are considered “dry powder” for when attractive longer-term opportunities arise and are categorized as short- and intermediate-term. These can be easily converted to cash without having to accept meaningful bid-ask spreads to liquidate the position. (Large cash positions could materially impact the fund’s duration.)
Guggenheim Partners
Investment Philosophy and Process
The Guggenheim Multi Credit strategy will seek to maximize total return through a combination of current income and capital appreciation. The team seeks to achieve its investment objective by investing in a wide range of fixed-income and other debt and senior-equity securities selected from a variety of credit qualities and sectors, including, but not limited to, corporate bonds, loans and loan participations, structured finance investments, U.S. government and agency, mezzanine and preferred securities, and convertible securities.
Guggenheim believes that an emphasis on capital preservation, while capturing attractive yields and a sustainable income component, is the surest path to superior long-term investment results. The firm strongly believes that fixed-income markets are inefficient, and as a result, Guggenheim focuses on bottom-up, fundamental research to identify securities with attractive relative value, where prices are not reflective of a security’s intrinsic value for a given risk profile. They seek opportunities across fixed-income market sectors—especially in non-index-eligible securities—and they aim to take advantage of downturns/inefficiencies that occur during times of uncertainty. The team is benchmark agnostic when it comes to portfolio construction: Benchmark exposures to economic sectors, security weightings, credit quality, etc., are not taken into account. Managing overall portfolio risk, however, is critical and is accomplished through portfolio diversification, both across and within sectors, by limiting position sizes, conservative yield-curve positioning (when deemed appropriate), portfolio stress testing, establishing loss thresholds, and other measures. They do not attempt to time the market and they have a buy-to-own mindset. As a result, changes to portfolio positioning tend to be incremental, rather than sudden and drastic. Furthermore, the team does not attempt to add significant value through trading around marginal changes in the price of securities.
The strategy is flexible and is not constrained by duration, sector, issuer, or credit quality. Our (preliminary) longer-term return expectations for the strategy are in the ballpark of LIBOR plus 3%–4% over a market cycle, though we expect this return hurdle to be a moving target based on the macro environment and bottom-up opportunities.
When it comes to duration, the strategy is not designed to win based on predictions around short-term interest rate swings. In other words, we do not expect the team to build a portfolio of derivatives in an attempt to win a bet against when rates will rise or how the curve will move. (At the margin, the team will adjust duration using interest rate swaps.) Instead, the focus is on buying securities that meet the team’s credit criteria and that they think will outperform throughout an interest rate cycle. Bottom-up credit selection (structures such as floating-rate versus fixed-rate) will be a key driver of the fund’s duration as opposed to shorting or using significant derivative exposure. Therefore, we do not expect the fund’s duration to be negative. The strategy is dollar based (all non-dollar exposure is hedged).
Guggenheim’s investment approach is rooted in bottom-up credit selection, though in-house macroeconomic views serve as a “roadmap” to inform and guide portfolio construction considerations such as duration (interest rate sensitivity), credit quality, and credit structure, as well as exposures to economic sectors.
Credit selection is conducted by a deep team of sector and security analysts. Their focus is on understanding the underlying business, issuer financial strength, risks pertaining to cash flows, the capital structure (seniority of payments), debt covenants, etc. This analysis involves comprehensive industry analysis that incorporates inputs from industry experts, competitors, suppliers, servicers, and customers. It also incorporates a thorough analysis of creditworthiness under a variety of downside stress-test scenarios. An integral part of Guggenheim’s credit analysis is the dedicated legal team that examines pertinent covenants and terms affecting issues.
Though the process starts with detailed credit analysis, risk management plays a prominent role. The team studies a wide range of economic and market scenarios to understand what can happen and assess the possible impact these scenarios could have on the portfolio. The team will simultaneously strive to understand how specific changes in portfolio composition would lessen the downside (for example, upgrading credit quality or including different types of security structures), but importantly, they do not manage to specific short-term downside loss thresholds.
Scenarios can include those driven by macroeconomic risks (for example, an economic slowdown in China), changes in regulation, broad sector trends, or an assessment of liquidity at the sector, security, and industry levels. Scenario analysis at the portfolio level also includes the impact of interest rate changes along the different tenors of the curve—whether they are rapid and sharp or gradual.
At the credit level, the team might examine the effect of sudden mark-to-market shocks on the portfolio by assuming widening yield spreads for specific portfolio exposures. The team will also examine risks to specific economic sectors under a given stress-test scenario to quantify the potential downside risk. For example, in recent years the team re-evaluated the default, liquidity, and mark-to-market risk of energy holdings assuming a dramatic decline in oil prices.
The final piece of risk management is diversification. This plays into one of Guggenheim’s core beliefs, namely that over the long term the best way to make money is by not losing it, or at the very least by minimizing losses. The team seeks high levels of diversification across and within fixed-income sectors.
Portfolio Construction
We believe Guggenheim’s approach is defined by its team-oriented culture/investment process. While portfolio managers are responsible for executing investment decisions, these decisions are the result of a collaborative effort across the investment team. As is discussed in more detail below, these different groups include credit sector teams that analyze and vet the securities across the capital structure and are ultimately responsible for identifying securities for inclusion in the portfolios; the macroeconomic research team that seeks to identify potential investment themes as well as big-picture risks to the portfolio; and the portfolio construction group that works closely with the portfolio managers, among others, to identify appropriate sector allocation ranges based on prospective risk/return analysis. There is also a legal team that reviews credit structures and a risk officer who considers bigger-picture risks from both investment and operational perspectives. Each of these groups relies heavily on the others, resulting in a continuous sharing of data, insights, and feedback that informs idea generation, portfolio construction, key risks, and areas for opportunity. Below is a brief overview of some of the key contributors to the process:
Global Macroeconomics and Investment Research Team
The Global Macro and Investment Research group is an eight-person team that works with the firm’s chairman of investments and global chief investment officer, Scott Minerd, among others, to assess macro risks and the potential negative impact on portfolio exposures, while also evaluating opportunities. The primary goal is to generate ideas that are actionable for portfolio managers and sector teams. The group comprises two parts, namely Global Macro and Investment Research. The Global Macro subgroup’s focus includes understanding economic indicators and macroeconomic trends, which helps inform the firm’s view on interest rates, duration, and the shape of the yield curve. The Investment Research subgroup is more sector focused and works directly with professionals responsible for making investment decisions. The macro team works closely with sector teams, portfolio managers, and the portfolio construction group.
Portfolio Construction Group
The portfolio construction group plays a consultative role within Guggenheim and helps set strategic allocation parameters for the firm’s investment vehicles. The team utilizes several inputs when qualitatively determining soft portfolio allocation targets; these inputs include information provided by the macroeconomic research team, portfolio managers, and sector teams. Another key function of the portfolio construction group is to stress-test portfolios in order to get a clearer view of how the portfolio could be impacted across various scenarios, including sharp interest rate changes, or meaningful increases in yields due to market volatility.
Sector and Security Research
The credit analyst team consists of over 100 sector and security analysts who are responsible for finding and underwriting individual securities for use in the portfolios. The credit team spans many fixed-income sectors including structured securities, corporate credit (both investment-grade and high-yield bonds and loans), commercial mortgage loans, government securities, and municipals. The corporate credit team is the largest team and is headed by a corporate credit four-person investment committee that is ultimately responsible for deciding whether a credit is approved for portfolios. The corporate credit investment committee is supported by a team leader who oversees approximately 50 economic sector credit analysts, responsible for evaluating securities across the capital structure. These analysts are, in turn, supported by junior analysts. The structured securities team, while not as large as the corporate credit team, is a meaningful piece of the overall research effort. It too is headed by a five-person investment committee.
Portfolio Managers
Portfolio managers work closely with the macro group and portfolio construction group to develop target sector ranges and to analyze various risk scenarios, while they rely on sector and security research teams to identify ideas for the portfolio. Portfolio managers across Guggenheim have discretion on asset allocation decisions and portfolio positioning, provided it is within the framework of the firm’s overall view. Portfolio decisions are the end-result of a collaborative effort across different individuals and groups that make up the investment team, though Steve Brown and Adam Bloch are ultimately responsible for the day-to-day portfolio implementation of the strategy.
Neuberger Berman
Investment Philosophy and Process
Neuberger Berman runs a U.S. Index Option Income strategy. At its most basic level, writing/selling puts on an equity index with an at-the-money (ATM) strike price (the price at which the option can be exercised) is equivalent to insuring the put buyer against any losses due to the price of the index falling. Like any insurance provider, the put seller collects a premium to provide that insurance and hopes to profit over time by collecting more than they pay out (in addition to interest income on the amount they hold in reserve for future claims – the “collateral” in the case of put writing). The amount of premium varies according to a number of factors, including the market perception of risk, the length of the option, and whether the option is ATM when written (riskier for the seller, which necessitates a higher premium) or out-of-the-money (OTM) and by how much. The further OTM the option is, the less likely the index is to decline below the strike price, and thus the less likely the option seller is to be required to make a payment to the option buyer, so the premium is lower. (In the insurance analogy, selling further OTM options is the equivalent of an insurer having a higher deductible on the policies they write.)
At a macro level, Devens believes index option markets serve as a necessary capital market for risk transfer, similar to other risk underwriting markets such as debt or equity capital markets or traditional insurance markets. Equity index option premiums efficiently price the transfer of equity index risk between buyers and sellers, much like bond market yields price interest rate and credit risks. While bonds and stocks are exclusively underwritten by investment banks, almost any sophisticated investor is free to write an option contract on an exchange. This allows longer-term, well-capitalized investors to take advantage of the market structure built by the larger players, including the information flow and established options pricing. This is akin to an accessible insurance marketplace where the clearing price is set by insurers with high operating costs and high costs of capital (in the case of options, investment bank options desks and options market-makers). Other insurers with lower fixed costs or access to lower cost long-term capital (long-only investors with longer-term time horizons) can underwrite similar risks and generate similar revenue, but with higher profit margins. This is the market in which put selling operates and why it can generate attractive risk-adjusted returns.
The returns to equity index put-writing come from two risk premia (plus the return on collateral, which is typically invested in conservative, short-duration fixed-income). The first is the equity risk premium, or the return investors earn for holding equity risk. There is persistent evidence of a high degree of equity market efficiency in well-researched, liquid markets (for example, the U.S. large-cap market), which almost all investors accept to varying degrees. Devens believes that investors should also acknowledge the natural corollary related to options on stock indexes. For equity markets to be efficient, investors who hold the downside risk of an equity index should expect to earn the long-term equity risk premium consistent with owning the index. Essentially, the underwriters of equity risk should earn the equity risk premium over the long term regardless of how the risk is assumed, whether through direct ownership of the index or insuring its downside. If this were not the case, then equity markets would demonstrate a massive inefficiency, as investors could own the equity index and buy puts to protect the full value of their investment from any loss while still earning positive returns. A portion of put option premium must therefore compensate the put seller for the equity sensitivity of the option.
The second risk premium is the volatility risk premium. In addition to the compensation for equity sensitivity, the option seller must be compensated further for the added risk associated with insuring the downside of the index for some period in the future in an unpredictable world. Neither investors nor insurers assume risk with the intention of losing money over time, and option markets are not an exception. Because of the high degree of uncertainty, and the negatively skewed risk/return profile to which they are exposed, sellers of put options build in a significant cushion (or expected profit margin) to the premiums they collect from option buyers. Over time, this allows sellers of ATM puts to generate returns similar to owning the index.
Since 1986, the median put option premium yield collected by the Put Index has been over 1.5% per month, which implies an annual cost of over 18% for consistent S&P 500 put option buyers. Obviously, there are some periods where markets decline over the course of a month and the sellers of puts have to pay out on the “insurance” they’ve provided. Option markets are constantly reappraising equity market risk to adjust for both perceived and realized risks, and option premiums increase significantly during periods of heightened volatility and equity market losses, in much the same way that insurance premiums spike sharply after natural disasters cause losses to property insurers. Over time, the sellers of put options have made money consistently over multiyear periods despite occasional sharp losses.
The return profile of selling ATM index puts tends to be more stable than owning the index outright. In converting traditional equity investment return potential (which consists of capital appreciation and dividends) into tangible up-front cash flows via the consistent collection of option premiums and interest income, put-writing strategies make an explicit tradeoff between up-market participation and down-market participation, while still seeking reasonable returns in flat markets. The strategy will not participate in the upside of the index when it soars, but it will also lose less when the index suffers negative performance, due to the cash flows it collects that provide a significant cushion. The premiums the strategy collects also ratchet up significantly (sometimes dramatically) during periods of market losses (insurance gets more expensive after the hurricane), which typically helps the strategy recover from drawdowns more quickly than the equity index.
We can look at the Put Index to understand the return profile of selling ATM index puts. (The Put Index writes one ATM put option on the S&P 500 Index each month. There are countless variations on the strategy, but the “plain vanilla” index offers a good baseline to understand the strategy and has the benefit of a nearly 32-year history of modeled performance, spanning numerous market cycles and events.) From June 1986 through March 2018, the Put Index achieved a return similar to that of the S&P 500 Index while experiencing a notably lower level of volatility, lower beta, and smaller drawdowns. The annualized return of the Put Index was 9.9%, with a standard deviation of 9.9% as well, for a return/risk ratio of 1.0. The S&P 500 Index returned 10.2% with a 14.9% standard deviation, resulting in a lower return/risk ratio of 0.68. The Put Index had a beta to the equity index of 0.55, and a maximum drawdown of 32.7%, compared to the equity index’s max drawdown of 50.9%. In terms of recovery speed from drawdowns, the Put Index was equal to or faster than the equity index to recover from Black Monday, the Russian debt default, the tech bubble collapse, and the global financial crisis, often by a significant margin (for example, 16 months faster to recover following the global financial crisis).
Portfolio Construction
In executing the equity index put-writing strategy, Devens seeks to reduce the path dependence of the Put Index, as well as manage risk and enhance returns through thoughtful active management. He and the team diversify the underlying options by strike price and expiration date, writing approximately 30 puts, laddered from four to six-week expiration dates, intending for 20% to 25% to roll off each week and be replaced by new options. This diversification reduces the chance of bad luck creating a very negative short-term outcome (or worse, a series of negative short-term outcomes in a row) from selling only one put per month (for example, a steep drop in the equity index immediately after selling the put producing losses, but without the opportunity to immediately capture the higher option premium to help offset the losses).
Another critically important difference between the Put Index and the strategy NB will manage for the fund is the selection of the level of “moneyness” of the sold options (ATM versus OTM). The fund’s options will be 2% OTM vs. the Put Index selling ATM options—the equivalent of writing insurance policies with significant deductibles compared to no deductible. The same general return profile holds true for an OTM strategy as compared to the Put Index, but not surprisingly, the premiums collected are lower (as are the volatility and drawdowns due to the downside buffer built in by the “deductible”). In NB’s historical simulations of the 2% OTM variation of the strategy, the returns are closer to high-yield bonds (upper single digits), with long-term standard deviation of approximately 6%, well below equity volatility in the mid-teens and high yield’s upper single digits. The maximum drawdown (during the financial crisis) was 16%, about half that of high-yield bonds, and one-third that of the S&P 500 Index. (A significant part of returns over time, and a meaningful part of outperformance during equity index drawdowns comes from the collateral portfolio being invested in a short-maturity Treasury bond portfolio, which typically performs well during periods of “flight-to-safety.”)
Risk management is a function of a number of factors, one being the overall sizing of the allocation at the fund level, since the strategy has significant equity correlation (but inherently lower beta and lower downside risk). Secondly, the selection of ATM or OTM, and how far OTM, influences the level of risk materially. Lastly, the team seeks to actively reduce downside (“left tail”) exposures to mitigate equity risk and loss potential by buying back a portion of the put options that are underwater and selling new put options at significantly higher premiums. (This is like an insurance company being able to cancel the insurance policy (at a loss, to be sure) once the hurricane has started, and then writing new policies with much higher rates in a different geographic area.) Put writing is not a strategy built on a philosophy of explicit risk avoidance; rather, it is rooted in seeking compensation to underwrite risks that other investors often overpay to mitigate. It doesn’t swing for home runs, but instead seeks to consistently hit singles and doubles and limit strikeouts. Investors in the strategy accept limited upside returns in exchange for less frequent, smaller return drawdowns (similar to many hedge fund strategies, but without the potentially onerous fees and terms).
As option-writing strategies continue to grow as strategic allocations for investors, the team believes that the benefits of passive equity investing will not translate into options strategies. Options markets are transparent, so sizable positions in specific option contracts are widely observed by the relatively limited number of exchange participants and option dealers. This leads to the expectation that as passive options strategies scale, they will not produce the same positive feedback loop that can occur in passive equity investing. Passively buying stocks in an index can drive the index value higher. Conversely, passively selling options can result in a reduction of the premium yield collected by investors. Meanwhile, too frequent active trading can result in high transaction costs and potentially getting whipsawed by the market in sharp reversals, while not collecting sufficient premium for the level of risk being underwritten. There are risks in both passive and hyperactive tactical implementations. Thus, Devens believes a balanced, systematic approach that seeks to manage risk, while still consistently collecting premium during periods of heightened volatility offers the highest probability of long-term success.
Manager Allocations
The manager allocations are as follows:
- BBH 40%
- Guggenheim 40%
- Neuberger Berman 20%
Manager allocations were the result of combining qualitative and quantitative inputs. Qualitatively, it started with our understanding of each manager and their investment strategies, as well as our forward-looking expectations of their individual risk profiles and likely returns across a range of economic, interest rate, and credit market scenarios.
To test our initial thinking and expectations, we evaluated historical performance of actual track records as well as historical asset class performance data. For example, Guggenheim has run a separate-account strategy with a performance record going back to 2009, and BBH has a track record that goes back to mid-2014. Ultimately, we were able to put together a combination of live track records and what we felt were reasonable approximations for all managers. Looking at those results for each manager/strategy was very consistent with our initial expectations.
From there, we ran different combinations of allocations to the four managers, and those results, again, were consistent with our ex-ante range of expectations for the potential allocations we initially created. The mix of our qualitative assessments and our review of the data led us to the final strategic weightings, which we believe will achieve an attractive balance of high income with a reasonable level of risk.
We gave larger allocations to BBH and Guggenheim because they have the most flexible strategies with the widest opportunity sets, and we have longer histories of investing with both of those firms. Neuberger Berman’s strategy has a lower weight than BBH and Guggenheim because it can have periodic, significant short-term downside. We have a lot of confidence in this strategy, but risk management factored into the allocation decision.
Performance
Since the fund’s September 2018 inception (thru October 2022), it has an annualized gain of 1.87%. This return outperforms both the Bloomberg US Aggregate Bond Index’s loss of 0.35% and the 1.71% return for high-yield bonds. The fund is also ahead of its Nontraditional Bond peers, which have gained 0.27% over the same period. The fund’s trailing performance is in line with our expectations as the fund was designed to outperform core investment-grade bonds and to be competitive with high-yield bonds over a cycle. From a volatility standpoint, the expectation was that standard deviation would be higher than investment-grade bonds but lower than high-yield. Since inception, the fund’s standard deviation is 8.43 compared to 5.52 for the Aggregate bond index and 10.14 for high-yield bonds.
|
Trailing Returns as of 10/31/2022 |
Year-to-Date |
1-Year |
3-Year |
Since Inception |
|
iMGP High Income Alternatives Fund |
-8.62 |
-8.01 |
1.29 |
1.87 |
|
ICE BofA US High Yield Index |
-12.19 |
-11.45 |
0.18 |
1.71 |
|
Bloomberg US Aggregate Bond Index |
-15.72 |
-15.68 |
-3.77 |
-0.35 |
|
US Fund Nontraditional Bond |
-7.99 |
-7.97 |
-0.52 |
0.27 |
Source: Morningstar Direct. Data as of 10/31/2022.
Inception date: 9/28/2018
|
Trailing Standard Deviation as of 10/31/2022 |
1-Year |
3-Year |
Since Inception |
|
iMGP High Income Alternatives Fund |
5.66 |
9.58 |
8.43 |
|
ICE BofA US High Yield Index |
11.85 |
11.26 |
10.14 |
|
Bloomberg US Aggregate Bond Index |
6.77 |
5.38 |
5.22 |
|
US Fund Nontraditional Bond |
6.04 |
7.27 |
5.05 |
Source: Morningstar Direct. Data as of 10/31/2022.
Performance data quoted represents past performance and does not guarantee future results. The investment return and principal value of an investment will fluctuate so that that an investor’s shares, when redeemed, may be worth more or less than their original cost. Current performance of the fund may be lower or higher than the performance quoted. Investment performance reflects fee waivers in effect. In the absence of such waivers, total return would be reduced. Short term performance is not a good indication of the fund’s future performance and should not be the sole basis for investing in the fund. Indexes are unmanaged, do not incur fees, and cannot be invested in directly. Returns less than one year are not annualized.
When evaluating performance, we always find it helpful to look at rolling 1- and 3-year rolling statistics versus benchmarks and peers, as it is less endpoint specific. Below are the percentage of periods that the fund outperformed high-yield bonds, the Bloomberg US Aggregate Bond Index, and the Nontraditional Bond peers. In the rolling one-year periods (38 observations), the fund has outperformed the benchmarks and peers in more than 50% of the periods. Looking at rolling 3-year periods, the number of observations is limited, but the fund has outperformed its Nontraditional Bond peers in 100% of the periods and the Aggregate Bond Index is 93% of the periods. When compared to high-yield bonds, the fund has outperformed in more than half of the periods. Interestingly, when we look closer at the rolling 1-year returns, the fund has outperformed high-yield bonds for 21 consecutive rolling periods, which includes markets where high-yield posted double-digit gains and losses. For example, in the 12-month period ending March 2021, high-yield gained 23.31%, while the fund was up 25.12%. And in the period ended September 2022, high-yield declined 14.06%, while the fund was down 8.12%. The fund has also outperformed the Aggregate Bond Index and the peer group in the past 22 consecutive rolling one-year periods.
When looking at rolling 3-year periods, there are only 14 observations. The fund has outperformed the peer group in each period, with the lowest level of outperformance (September 2022) being 1.82% (annualized). The maximum outperformance was 2.97%, period ending December 2021. Compared to the Aggregate Bond Index, the fund has outperformed in 13 out of 14 periods, and the one period of outperformance (period ending September 2021) was only 0.04%. Versus high-yield bonds, performance has been more mixed, but the fund has outperformed in the most recent eight consecutive observations.

Source: Morningstar Direct. Data as of 10/31/2022.

Source: Morningstar Direct. Data as of 10/31/2022.
Performance data quoted represents past performance and does not guarantee future results. The investment return and principal value of an investment will fluctuate so that that an investor’s shares, when redeemed, may be worth more or less than their original cost. Current performance of the fund may be lower or higher than the performance quoted. Investment performance reflects fee waivers in effect. In the absence of such waivers, total return would be reduced. Short term performance is not a good indication of the fund’s future performance and should not be the sole basis for investing in the fund. Indexes are unmanaged, do not incur fees, and cannot be invested in directly. Returns less than one year are not annualized.
When evaluating trailing and prospective performance, it is important to highlight that in January 2021, we removed one of the fund’s original four sub-advisors, Ares Capital Management. When we initially constructed the fund, Ares had the lowest allocation (15%) of the four sub-advisors, despite being a team and strategy in which we had a lot of confidence. The lower allocation was mostly a risk-management consideration. The Ares’ strategy had the highest expected long-term returns, but also the largest downside and volatility risk, and we wanted to limit the fund’s exposure to short-term downside risk.
The decision to remove Ares in early 2021 was based on their plan to modify their strategy to a narrower opportunity set. The original opportunity set for their sleeve had included BDCs, MLP, mortgage REITs, and opportunistically, discounted closed-end credit funds. But when Ares wanted to focus purely on BDCs, their strategy no longer fit the desired risk-return profile of the fund. We removed Ares and their allocation was split evenly among the funds’ two flexible credit managers, Brown Brothers Harriman and Guggenheim, resulting in the current sub-advisor allocation.
Since removing Ares in January 2021, the fund has declined 1.85% (annualized through 10/31/22) compared to a loss of 9.76% for the Bloomberg US Aggregate Bond index and a decline of 4.85% for high-yield bonds. As a result of removing the Ares strategy, the fund’s downside risk has been lower with the current line-up. For example, during the Covid drawdown in early 2020, the fund declined 14.27% between January 31 and March 31. Comparatively, high-yield bonds were down 13.13%. Demonstrating the point, we looked at the sleeve performance of the three current subadvisors and weighted the strategies using their current weights. The fund would have declined a more modest 9.73% during the same period.
Looking at the year-to-date 2022 decline through October, high-yield bonds have fallen 12.19%, a similar level to that of the Covid decline, but the fund has held up better, declining 8.62%. The downturns occurred for different reasons, but we think the recent decline demonstrates the fund’s downside protection with the current line-up.

Source: Morningstar Direct. Data as of 10/31/2022.
Opinion
Given the composition of the fund, it does not fit perfectly in a typical asset-classification box or asset allocation pie chart. (As analysts, we believe this is often the sign of an interesting opportunity.) But broadly speaking, we see the fund as a strategic part of an investor’s diversified fixed-income allocation, offering access to proven managers with expertise in non-traditional income markets and niches.
In conclusion, we highlight that the fixed-income market has become far more diverse following the 2008 global financial crisis, particularly as banks and other lenders have pulled back from areas they had traditionally financed. This has created an opportunity for investors to help fill those gaps. Some opportunities require private, longer-duration capital, but some, like non-traditional ABS, can be included as part of a more liquid portfolio. Some income investment options such as BDCs address some of these voids with permanent capital vehicles, which are then themselves publicly traded and issue bonds that our managers can own. We think investors should take advantage of this increased opportunity set for both greater income and potential diversification benefits, rather than be constrained purely to traditional investment-grade fixed-income. This is especially true now, since traditional core bonds are subject to much higher interest rate risk, while offering historically low yields. We believe there is a compelling opportunity for skilled, active managers to generate high income and attractive risk-adjusted returns in the broad spectrum of non-traditional income sectors.
Note: For discretionary use by investment professionals. This document is provided by iM Global Partner Fund Management, LLC (“iMGPFM”) for informational purposes only and no statement is to be construed as a solicitation or offer to buy or sell a security, or the rendering of personalized investment advice. There is no agreement or understanding that iMGPFM will provide individual advice to any investor or advisory client in receipt of this document. Certain information constitutes “forward-looking statements” and due to various risks and uncertainties actual events or results may differ from those projected. Some information contained in this report may be derived from sources that we believe to be reliable; however, we do not guarantee the accuracy or timeliness of such information. Past performance may not be indicative of future results and there can be no assurance the views and opinions expressed herein will come to pass. Investing involves risk, including the potential loss of principal. Any reference to a market index is included for illustrative purposes only, as an index is not a security in which an investment can be made. Indexes are unmanaged vehicles that do not account for the deduction of fees and expenses generally associated with investable products. A list of all recommendations made by iMGPFM within the immediately preceding one year is available upon request at no charge. For additional information about iMGPFM, please consult the Firm’s Form ADV disclosure documents, the most recent versions of which are available on the SEC’s Investment Adviser Public Disclosure website (adviserinfo.sec.gov) and may otherwise be made available upon written request.
The [investor] acknowledges that AdvisorIntelligence is beneficially owned by iM Square SAS, a Paris based investment and development platform (“iM Square”). AdvisorIntelligence, from time to time, expects to include in its investment models certain investment funds (collectively, “iM Square Funds”) sponsored or managed by investment advisers in which iM Square has a beneficial ownership interest (“IMGPUS Affiliates”). This arrangement creates a material conflict of interest because AdvisorIntelligence has an incentive to include iM Square Funds in its investment models. IMGPUS Affiliates do not waive fees for these investments. Therefore, assets invested in iM Square Funds will be charged two layers of fees, one by AdvisorIntelligence and another by the iM Square Funds.
Our due diligence process for managers and funds is grounded in our conviction, supported by extensive research, that skilled managers can and do deliver superior performance over the long term. An essential part of the value we provide is the multiple decades of experience we bring to bear in assessing and selecting exceptionally skilled managers. We engage in exhaustive quantitative and qualitative research aimed at uncovering those select managers with an identifiable and sustainable investing edge. Here are just a few critical elements we look for in our due diligence:
- A clearly defined and well-articulated investment process supported by evidence of successful implementation over time
- A manager or team that demonstrates a high level of integrity, intellectual honesty, and a passion for investing
- Supportive team dynamics and a culture that insulates key investment personnel from noninvestment-related responsibilities
- Outperformance versus relevant benchmarks and peers that is consistent with our expectations given certain market environments
- Consistent outperformance (i.e., over rolling periods) versus benchmarks and peers that is a result of a time-tested investment process
This rigorous process yields a select list of managers. For those we decide to invest with, our analysis is not a once-and-done exercise. We continue to closely monitor fund performance and investment decisions through regular updates with our managers, aimed at making sure they remain committed to their investment process and disciplined in its execution and is the basis for the opinions shown below.
Recommended = These are funds we are confident will outperform an index fund alternative over a market cycle.
Approved+ = Approved funds we are actively researching and consider to be realistic candidates for upgrading to Recommended.
Approved = Funds we believe will perform at least as well as, if not in excess of, an index fund alternative over a market cycle.
Noteworthy = Funds we view as promising. The record may be too short or we may need to do additional due diligence before making a final decision on the status (Approved, Recommended) of the fund.
Under Review = We are currently conducting follow-up due diligence to address questions that have arisen since our last review. While these questions are material enough to warrant further investigation, we do not feel they are material enough to warrant an immediate downgrade.
Recommendation - Index Funds & ETFs
Core = Funds/ETFs that are our preferred vehicle for gaining index exposure to an asset class. These vehicles are recommended for those who would rather use an index fund in lieu of funds in the model portfolios.
Tactical = ETFs and index funds we are currently using or have used in the past for tactical purposes in place of Core funds.
Alternative = Funds we believe are acceptable alternatives to Core funds, though they are not our preferred choice due to any number of factors, including expenses, asset base, index construction and methodology, and the experience of the fund sponsor.
Resources
Related research

Third Quarter 2023 Investment Commentary
After a strong first half to 2023, global equity markets declined in the third quarter. The S& ...

First Quarter 2023 Investment Commentary
Despite the stress in the banking system, including the second-largest bank failure in U.S. histor ...